Default Financial Dashboards & Workspaces
Dynamics 365 Finance ships with a set of pre-built, role-based dashboards — called workspaces — that give finance leaders and their teams a live operational view of the close, receivables, payables, cash and cost performance, without building a single custom report. This document explains how these dashboards are organized, walks through each of the standard finance workspaces available out of the box, and frames why each one matters from a leadership perspective: what it shows, who uses it day to day, and what business risk or opportunity it helps manage.
The scope here is the finance-related workspaces — general ledger and close, accounts payable, accounts receivable and credit, cash and bank management, fixed assets, cost accounting, and budgeting. Supply chain, retail, manufacturing and HR workspaces exist in the same platform but are outside the scope of this overview.
Microsoft uses three related but distinct terms, and understanding the distinction helps set expectations for what a “dashboard” in this system actually is.
Dashboard: the landing page a user sees at sign-in. It is a personalizable collection of tiles, each of which is simply a shortcut into an underlying workspace — there is no separate content maintained just for the dashboard itself.
Workspace: an activity-oriented page built around a business process or role. Every workspace follows the same pattern — task tiles showing counts or key metrics, actionable lists of items that need attention, and quick links to related tasks — so that staff spend their time on exceptions rather than searching through full transaction lists. This is the layer described in the rest of this document.
Analytical workspace (Power BI-embedded): a companion analytics layer, often surfaced as an “Analytics” tab within an operational workspace, that renders true Power BI visuals against near-real-time data — supporting drill-down, filtering and trend analysis rather than just point-in-time counts. Most of the finance workspaces below include one.
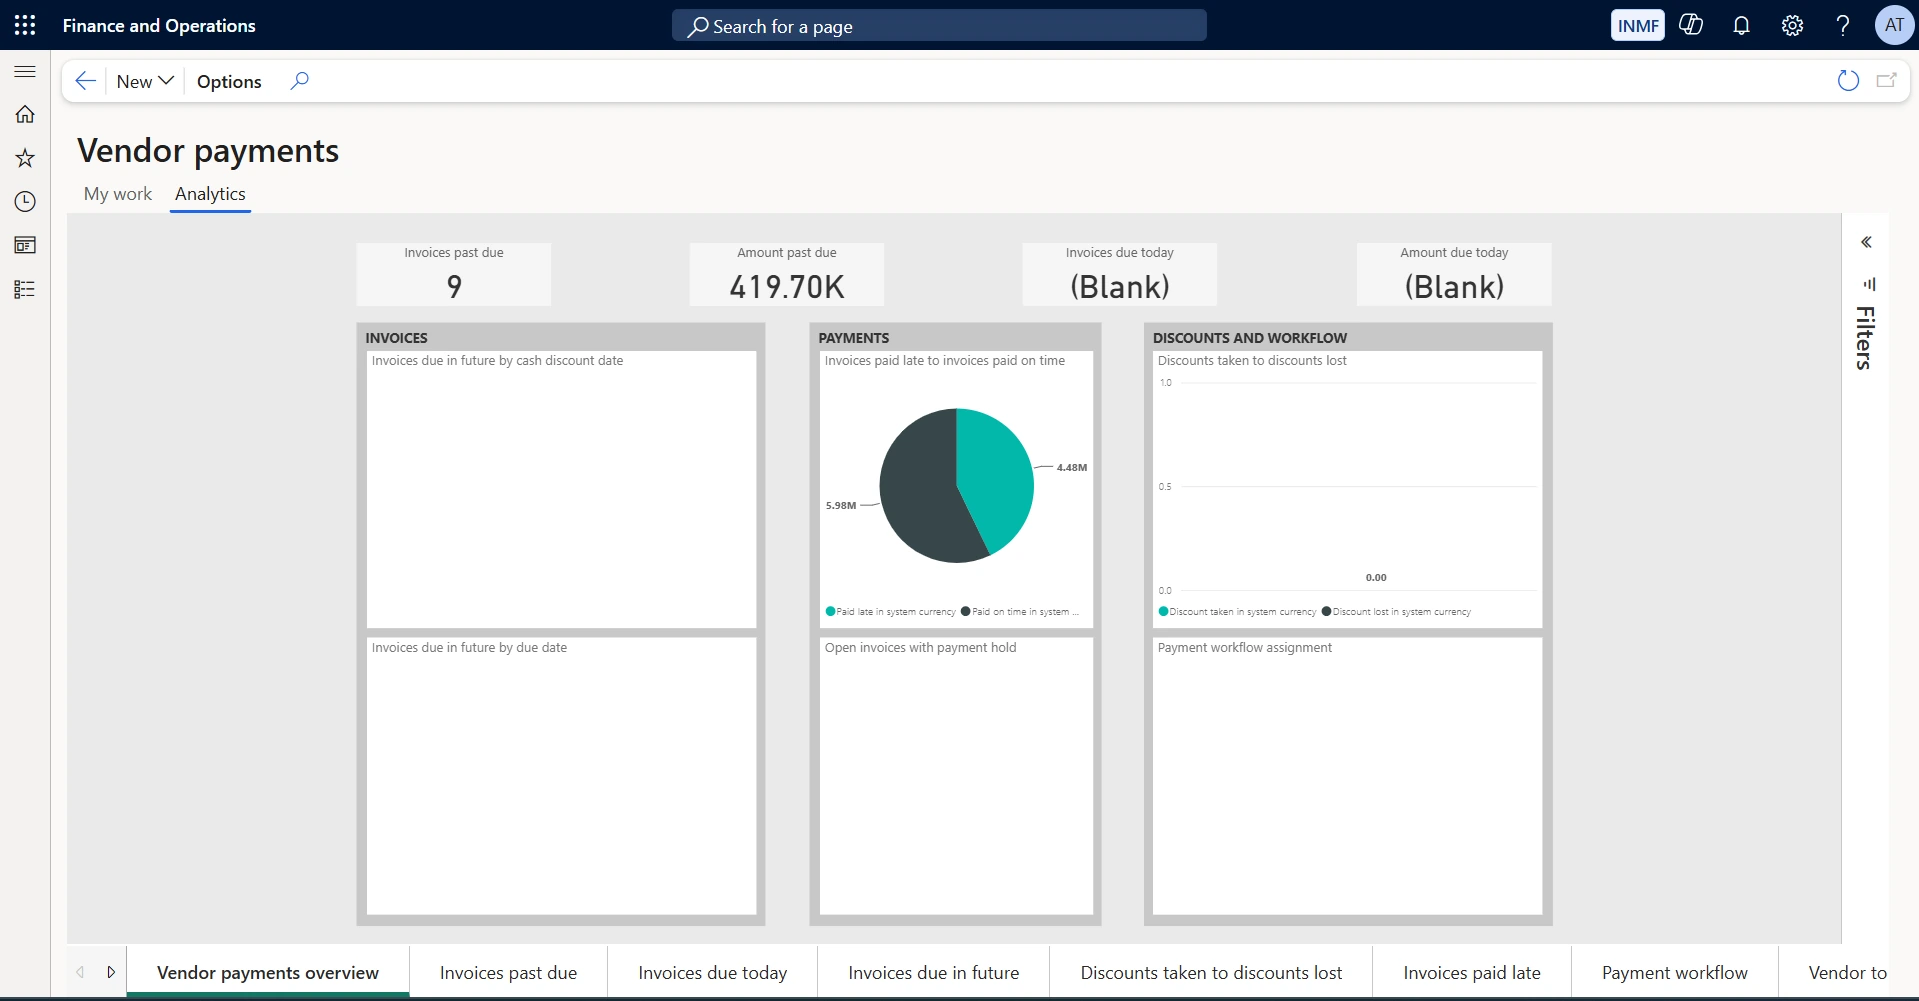
Example: an analytical workspace
Shows the standard anatomy of an analytical workspace — a row of KPI tiles across the top, with interactive Power BI visuals beneath, all rendered inside the Finance client rather than in a separate reporting tool. Use it as the reference pattern for every analytics tab in this document: the tiles answer "what is the number", the visuals below answer "why", and any element can be clicked to filter the rest of the page.
The table below gives a one-line answer to “why should I care about this dashboard” for each of the standard finance workspaces, before the detailed profiles that follow.
Workspace | Module area | Why it matters to leadership |
|---|---|---|
Financial period close workspace | General ledger / Close | Real-time visibility into close-task progress across every entity and process owner, surfacing bottlenecks before they slip the close calendar. |
Financial analysis workspace | General ledger / Reporting | Drillable, near-real-time balance sheet, income statement and ratio analysis without waiting for a formal reporting cycle. |
Vendor invoice workspace | Accounts payable | Exception-based tracking of invoices stuck in capture, matching, or approval so staff work only what needs attention. |
Vendor payments workspace | Accounts payable / Cash | Visibility into payment runs, overdue obligations and early-payment discount opportunities. |
Vendor collaboration invoicing | Accounts payable (vendor portal) | Shifts invoice submission and status checks to vendors, cutting AP data-entry and inquiry volume. |
Collections coordinator workspace | Accounts receivable / Collections | Focuses collectors on the highest-risk, highest-value accounts and speeds dispute resolution. |
Customer credit and collections workspace | Accounts receivable / Credit | The primary DSO, aging and credit-exposure view used to manage receivables health and cash forecasting. |
Bank management workspace | Cash and bank management | Consolidated, real-time liquidity position across every bank account and legal entity. |
Fixed asset management workspace | Fixed assets | Consolidated net book value, acquisitions and disposals across entities for capital planning and audit readiness. |
Cost control workspace | Cost accounting | Puts budget-versus-actual accountability directly in the hands of cost-center owners with automatic variance flags. |
Budget planning workspace | Budgeting | Central hub for building, reviewing and publishing operating budgets that feed budget control. |
Customer invoicing workspace | Accounts receivable / Billing | Surfaces shipped-but-unbilled orders and unposted invoices so earned revenue is invoiced promptly. |
Customer payments workspace | Accounts receivable / Cash application | Tracks unposted payment journals and unconfirmed electronic receipts so cash received is applied and aging stays accurate. |
Each profile below covers the workspace's purpose, the metrics and tiles it surfaces, the actions it enables, who typically uses it, and the business case for a leader to pay attention to it.
Financial period close workspace
Module area: General ledger — cross-module close orchestration (GL, AP, AR)
This workspace turns the month-end and year-end close from a set of emails and spreadsheets into a governed, trackable checklist. Every close task — journal reviews, reconciliations, sub-ledger cutoffs, tax filings — is scheduled, assigned, and time-stamped when completed, with dependencies that prevent a task from being marked done before its prerequisites are finished.
Financial period close
Shows the close status for a selected period: summary tiles for past due, remaining and blocked tasks, beside the full task list with area, company, responsible person and due date. Use it to run the close daily — filter by company or area to see which team is behind, open a task to attach evidence, and mark tasks complete so the dependency chain releases the next step.
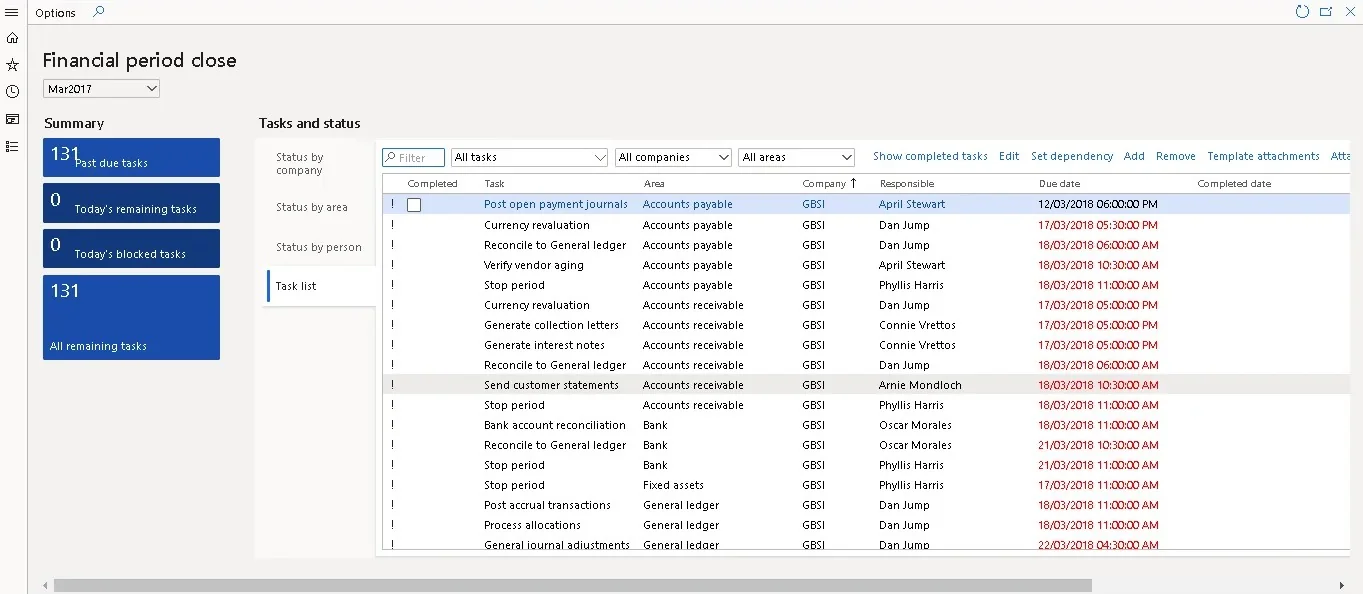
Key metrics & tiles | • Past due tasks • Remaining tasks for today • Tasks due today that are blocked by dependencies • All remaining tasks in the close process |
Typical actions & lists | • View close status by company, by process area, or by responsible person • Attach supporting files, notes, images or reference URLs to any task • Mark tasks complete (automatically date- and time-stamped) and enforce task dependencies • Maintain closing schedules, calendars and reusable close templates |
Who uses it | • Close managers and controllers (full visibility across all tasks and entities) • Accountants and process owners (assigned-task view only) |
Why it matters to leadership: Leadership gets a single, real-time answer to “where do we stand in the close?” across every legal entity, instead of finding out about a delay after the fact. Recurring bottlenecks and overdue owners are visible immediately, which shortens the close cycle and makes close performance auditable over time.
Financial analysis workspace
Module area: General ledger — financial reporting and analytics (Power BI-embedded)
Financial analysis is the modern, interactive analytics layer that sits on top of the general ledger and sub-ledgers. It replaces the older "CFO overview" content pack (still present in some legacy environments) with drillable Power BI visuals covering the statements and ratios leadership reviews most often.
The workspace is organised as twelve report pages, selected from the tab strip along the bottom of the screen: Financial overview, Revenue and expense insights, Subledger insights, Trial balance, Balance sheet, Income statement by region, Income statement actual vs budget, Income statement with variances, 12 month trend income statement, Expenses three-year trend, Expenses by vendor, and Sales by customer. Each page is reproduced below in the order it appears in the client.
Financial overview
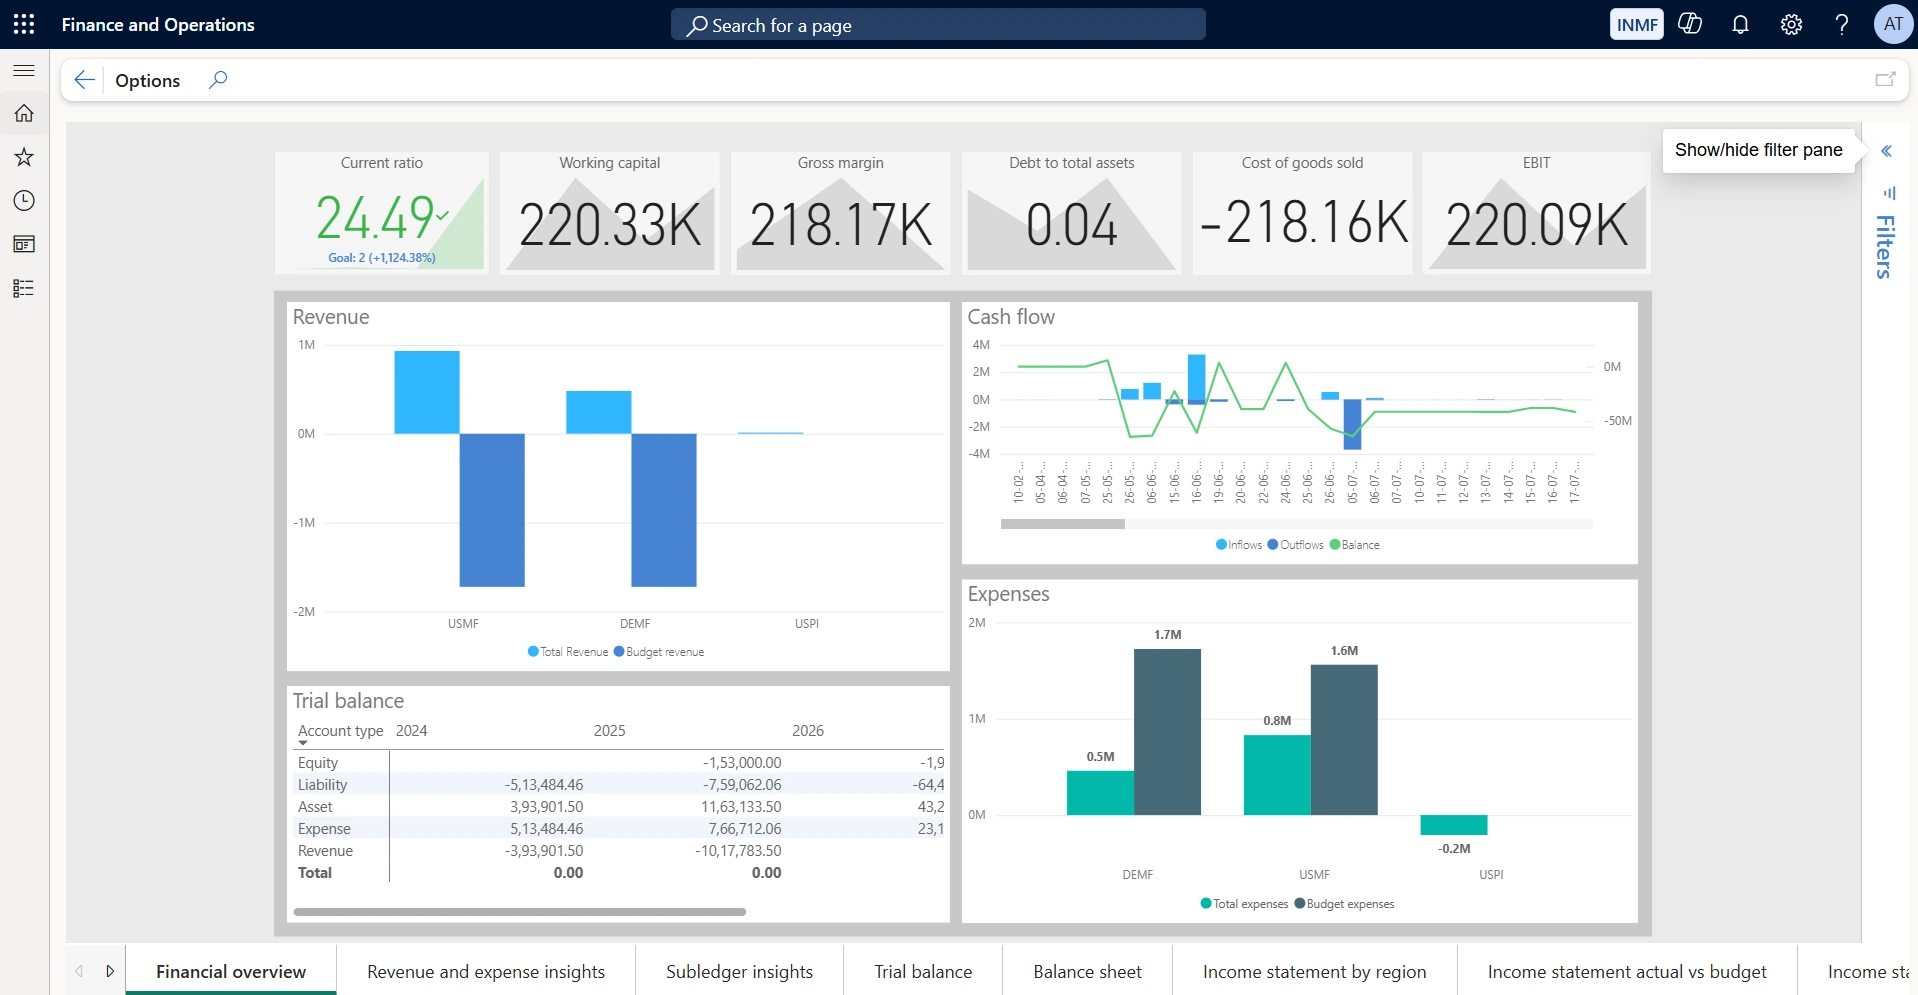
Shows the headline financial position: current ratio, working capital, gross margin, debt to total assets, cost of goods sold and EBIT, above revenue, cash flow, expense and trial balance visuals. Use it as the opening screen of any finance review — the tiles give the health check, and clicking a legal entity in the revenue or expense chart re-filters the whole page to that entity.
Revenue and expense insights
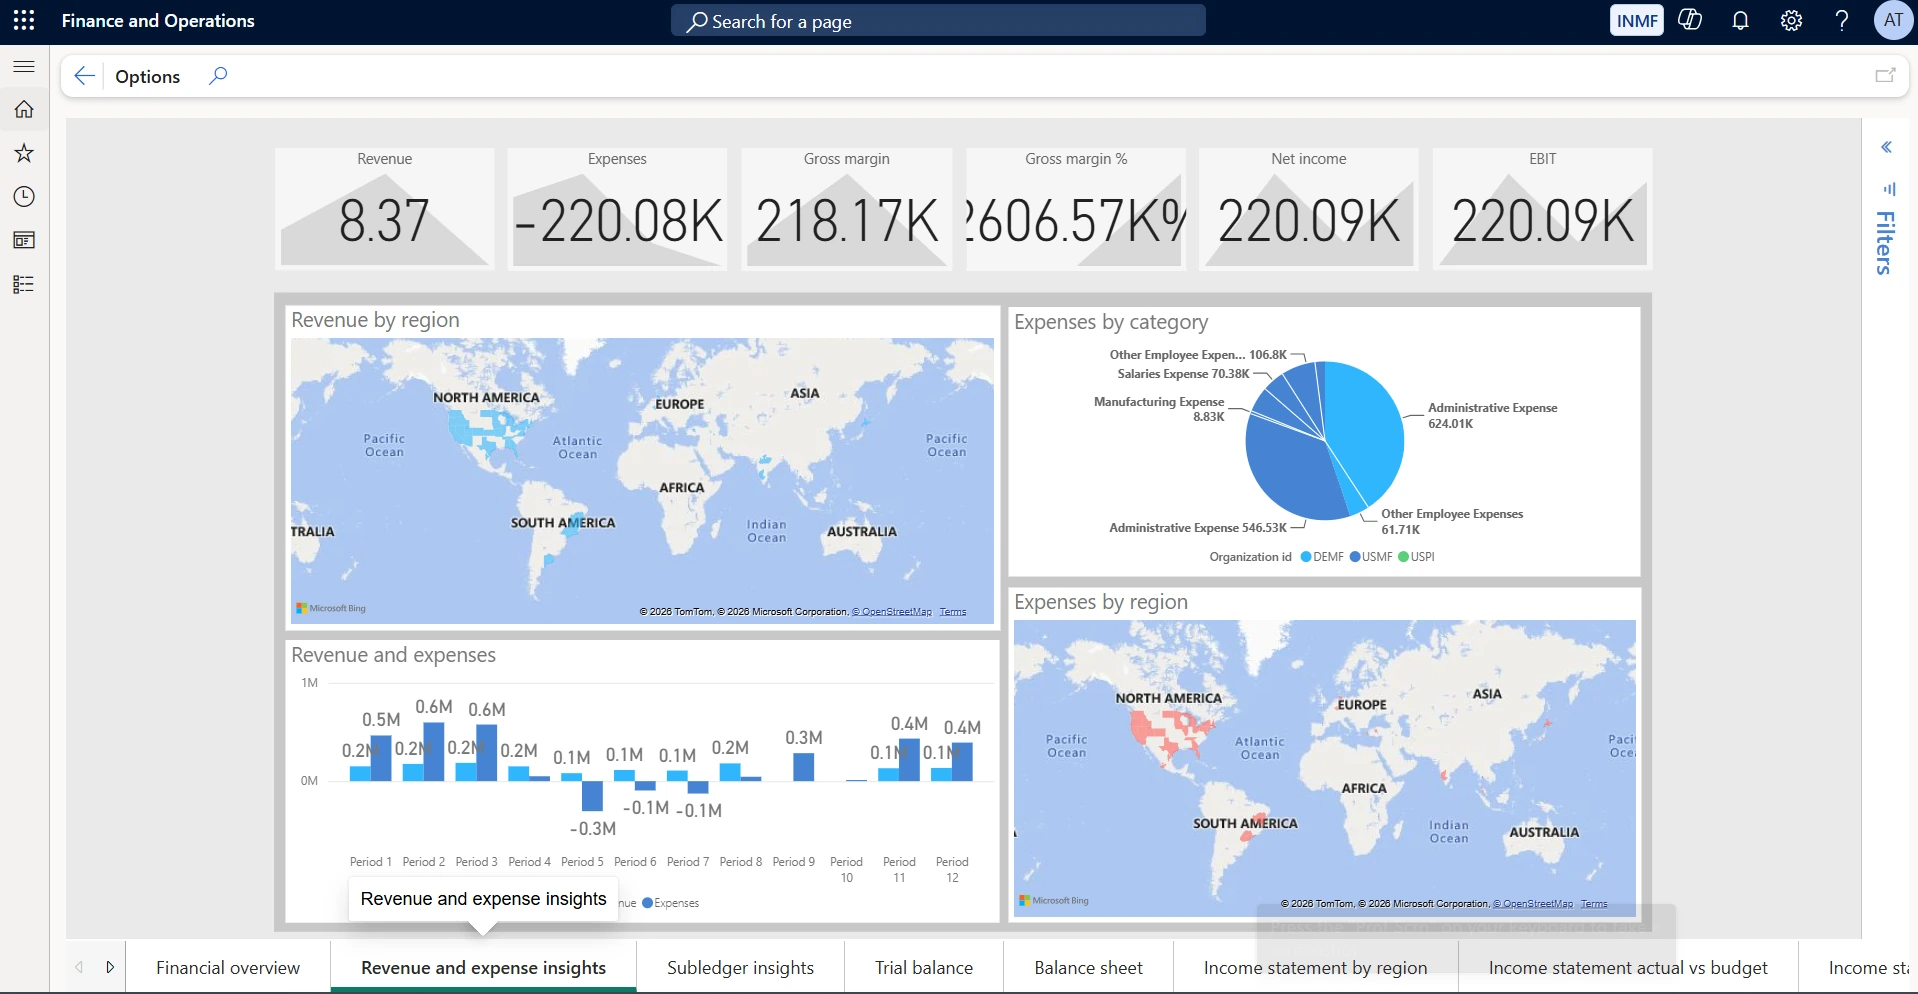
Shows revenue, expenses, gross margin, gross margin percentage, net income and EBIT, with revenue and expenses plotted by region and expenses split by category. Use it to answer where money is being earned and spent — select a region on the map or a slice of the expense pie to isolate that market or cost category across the rest of the page.
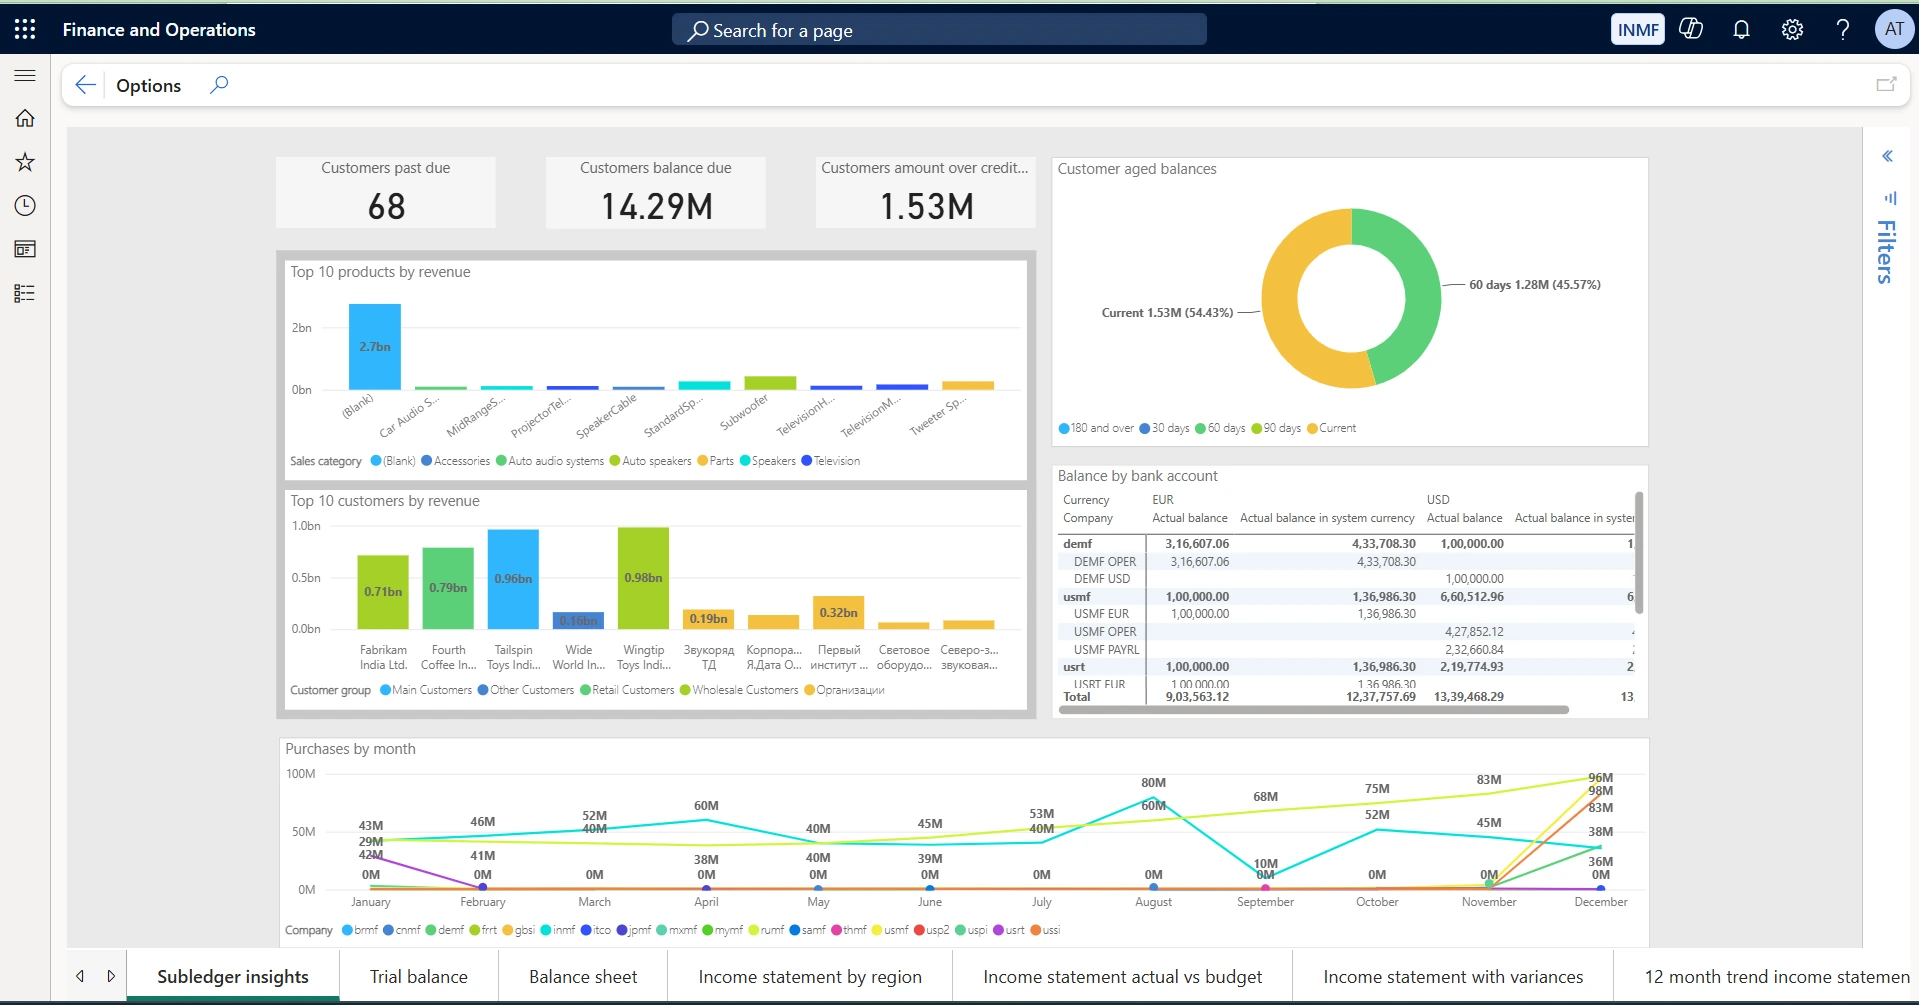
Subledger insights
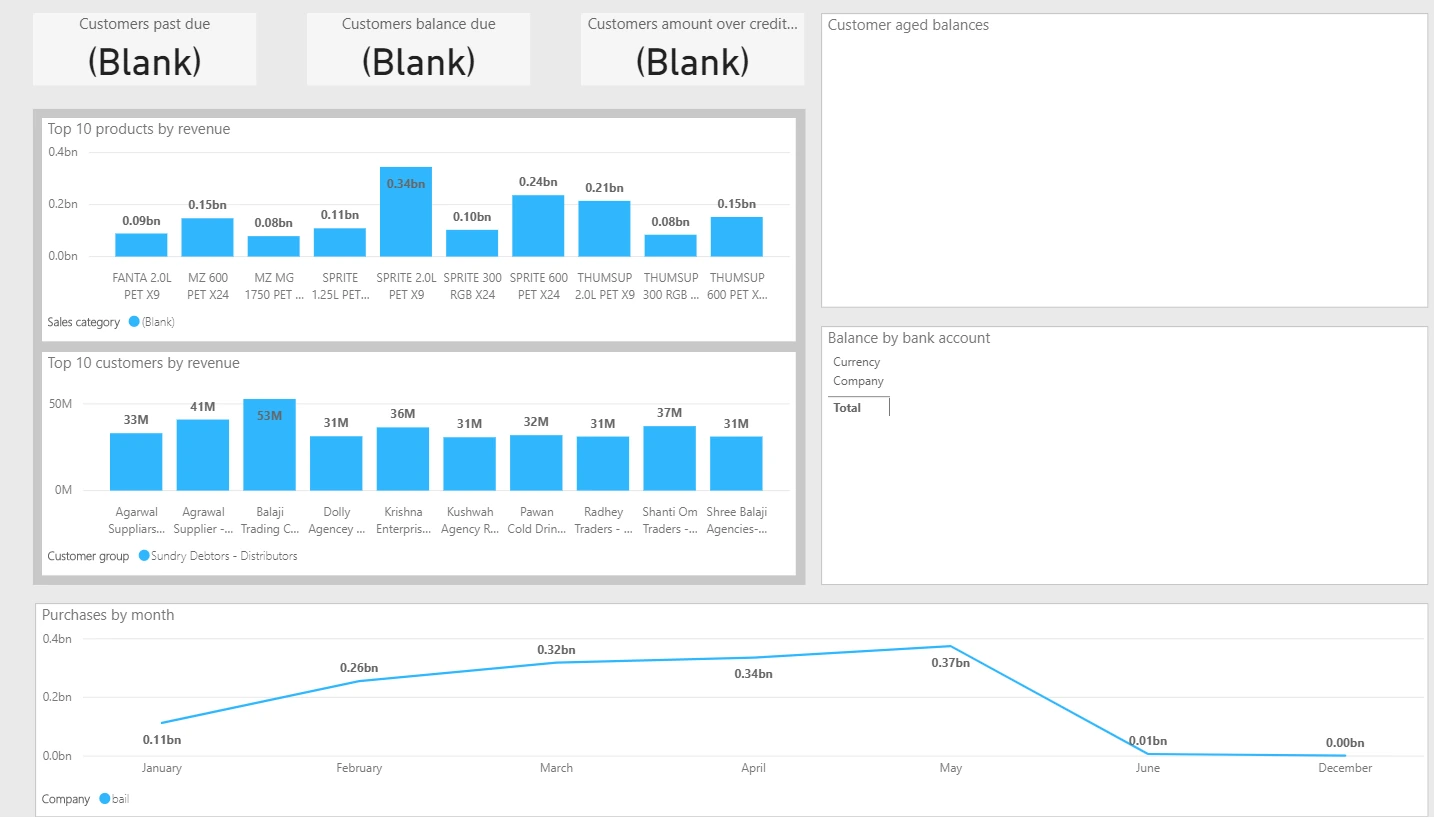
Shows the receivables and payables position alongside the ledger: customers past due, balance due and amount over credit limit, with top products and customers by revenue, customer aged balances, bank account balances and purchases by month. Use it to connect trading performance to working capital — for example, checking whether the customers driving revenue are also the ones sitting in the aged balance buckets.
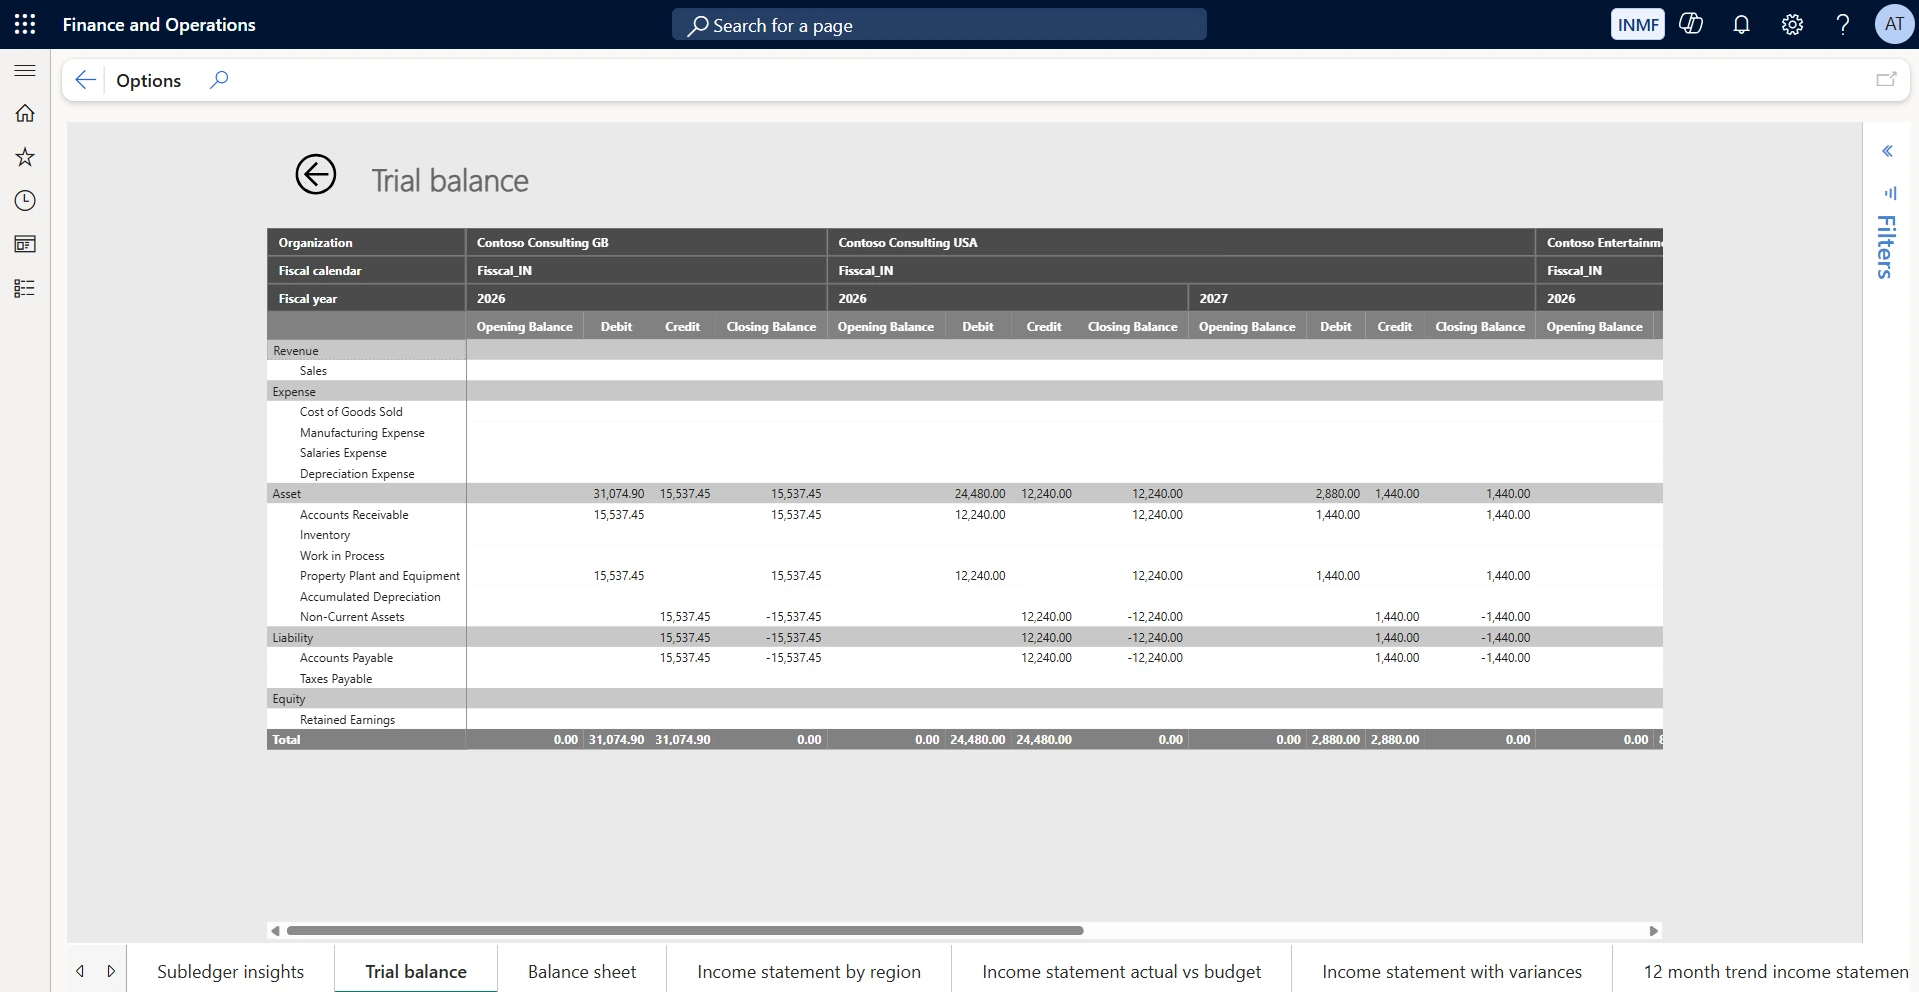
Trial balance
Shows opening balance, debit, credit and closing balance by account category, presented side by side for each legal entity and fiscal year. Use it for a fast pre-close sanity check across entities without running a separate report, and drill from any line into the postings behind it when a balance looks wrong.
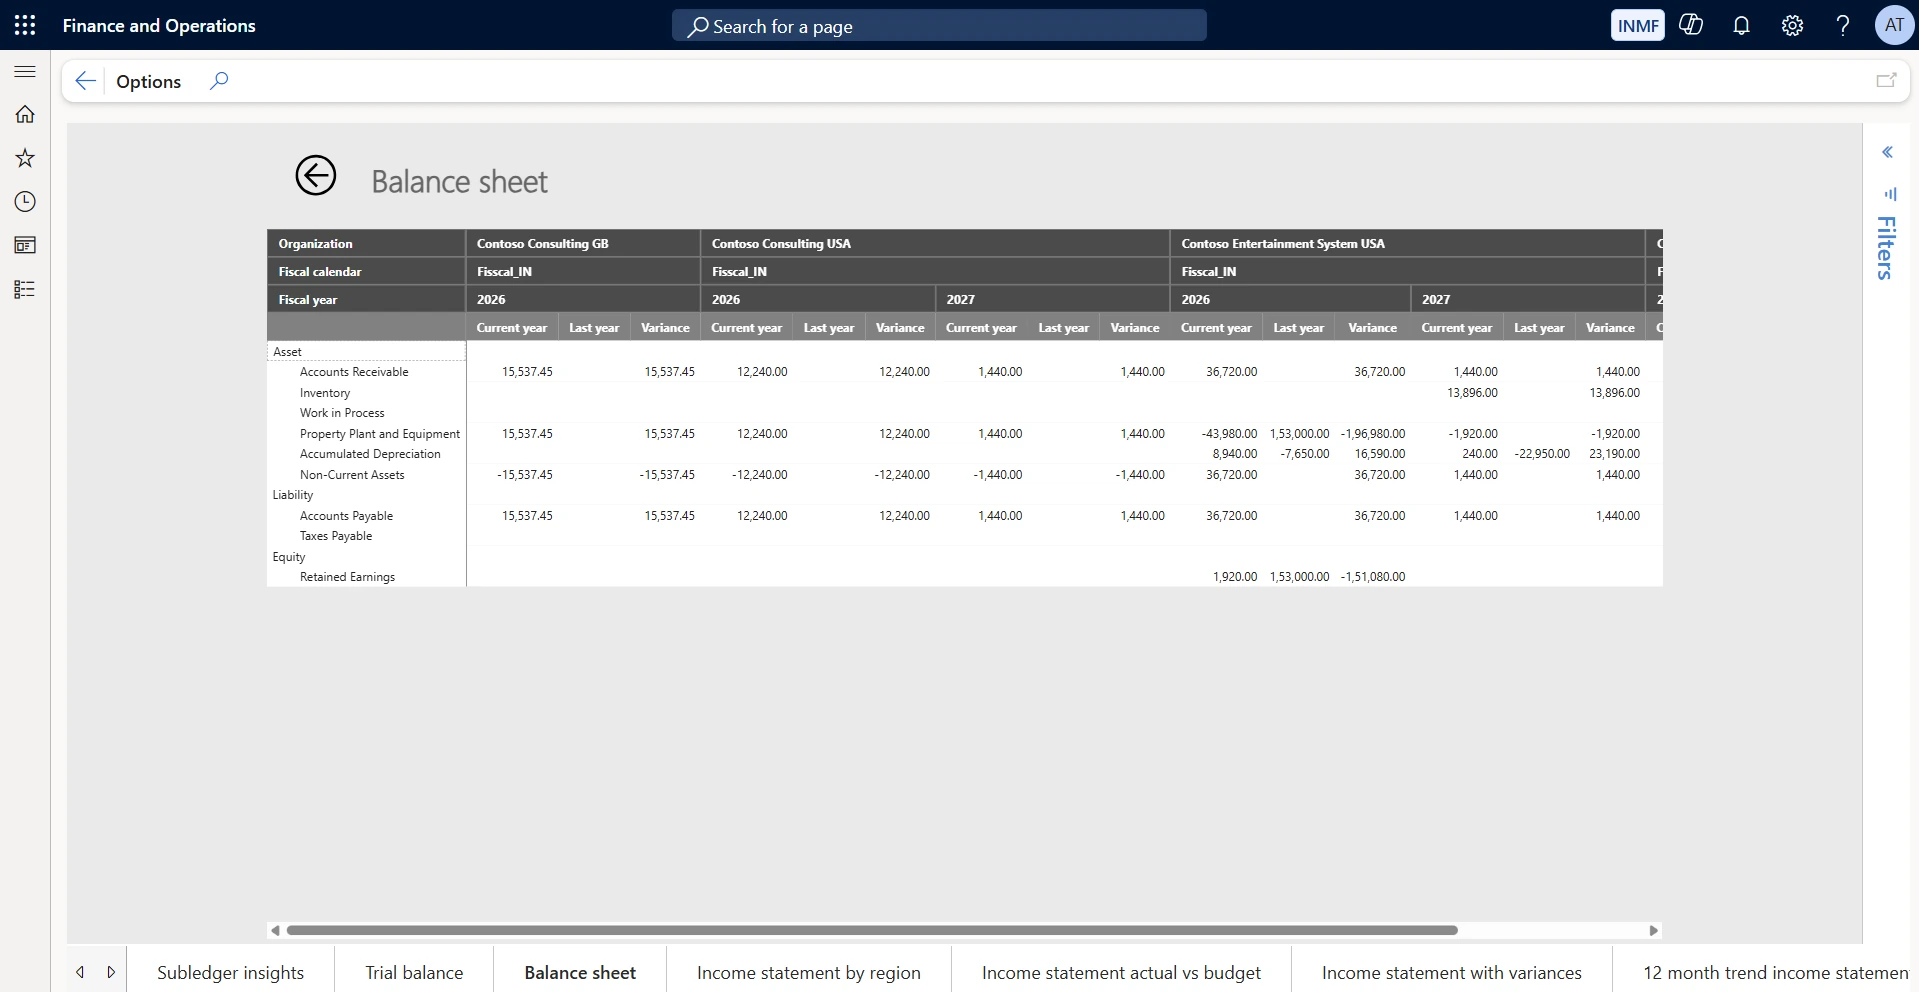
Balance sheet
Shows assets, liabilities and equity with current year, last year and variance columns for every legal entity on a single page. Use it for period-on-period comparison during review — the variance column highlights the movements worth explaining before the statements are formally issued.
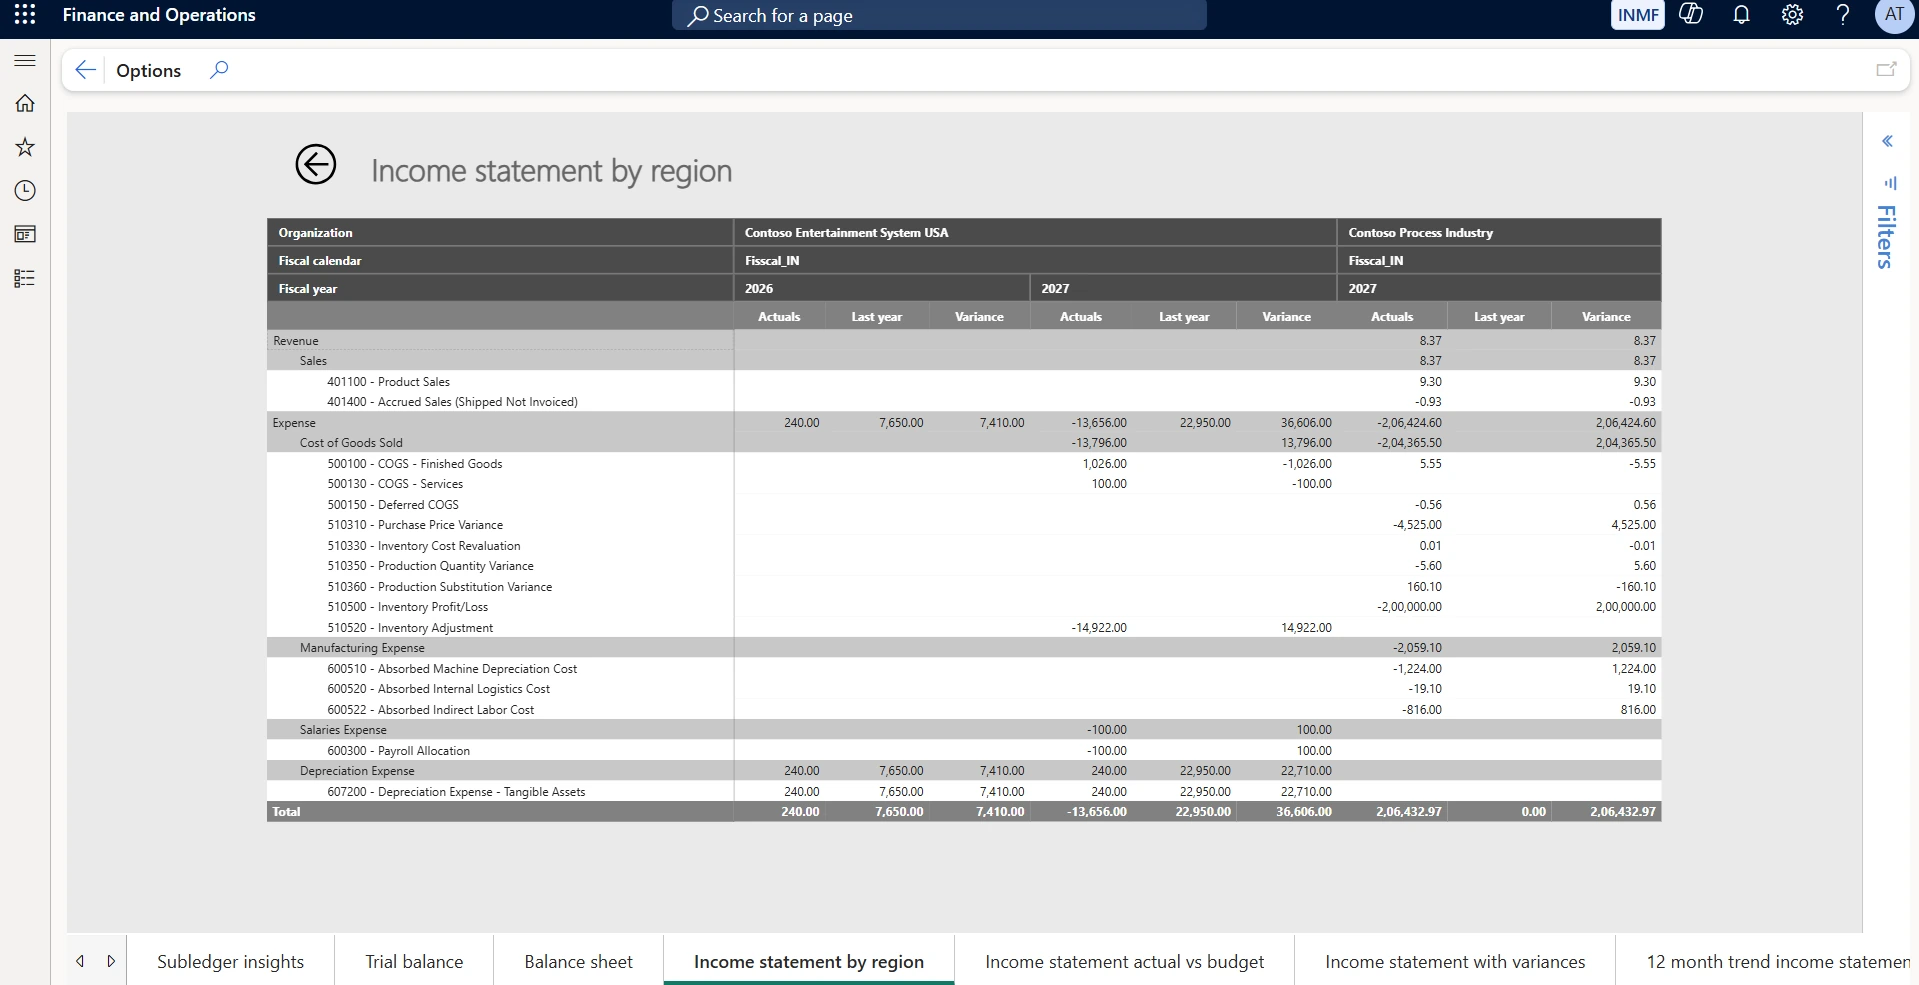
Income statement by region
Shows revenue and expense down to individual main accounts, with actuals, last year and variance per legal entity. Use it to explain a consolidated result — expand a category such as cost of goods sold to see which accounts and which entities are driving the movement.
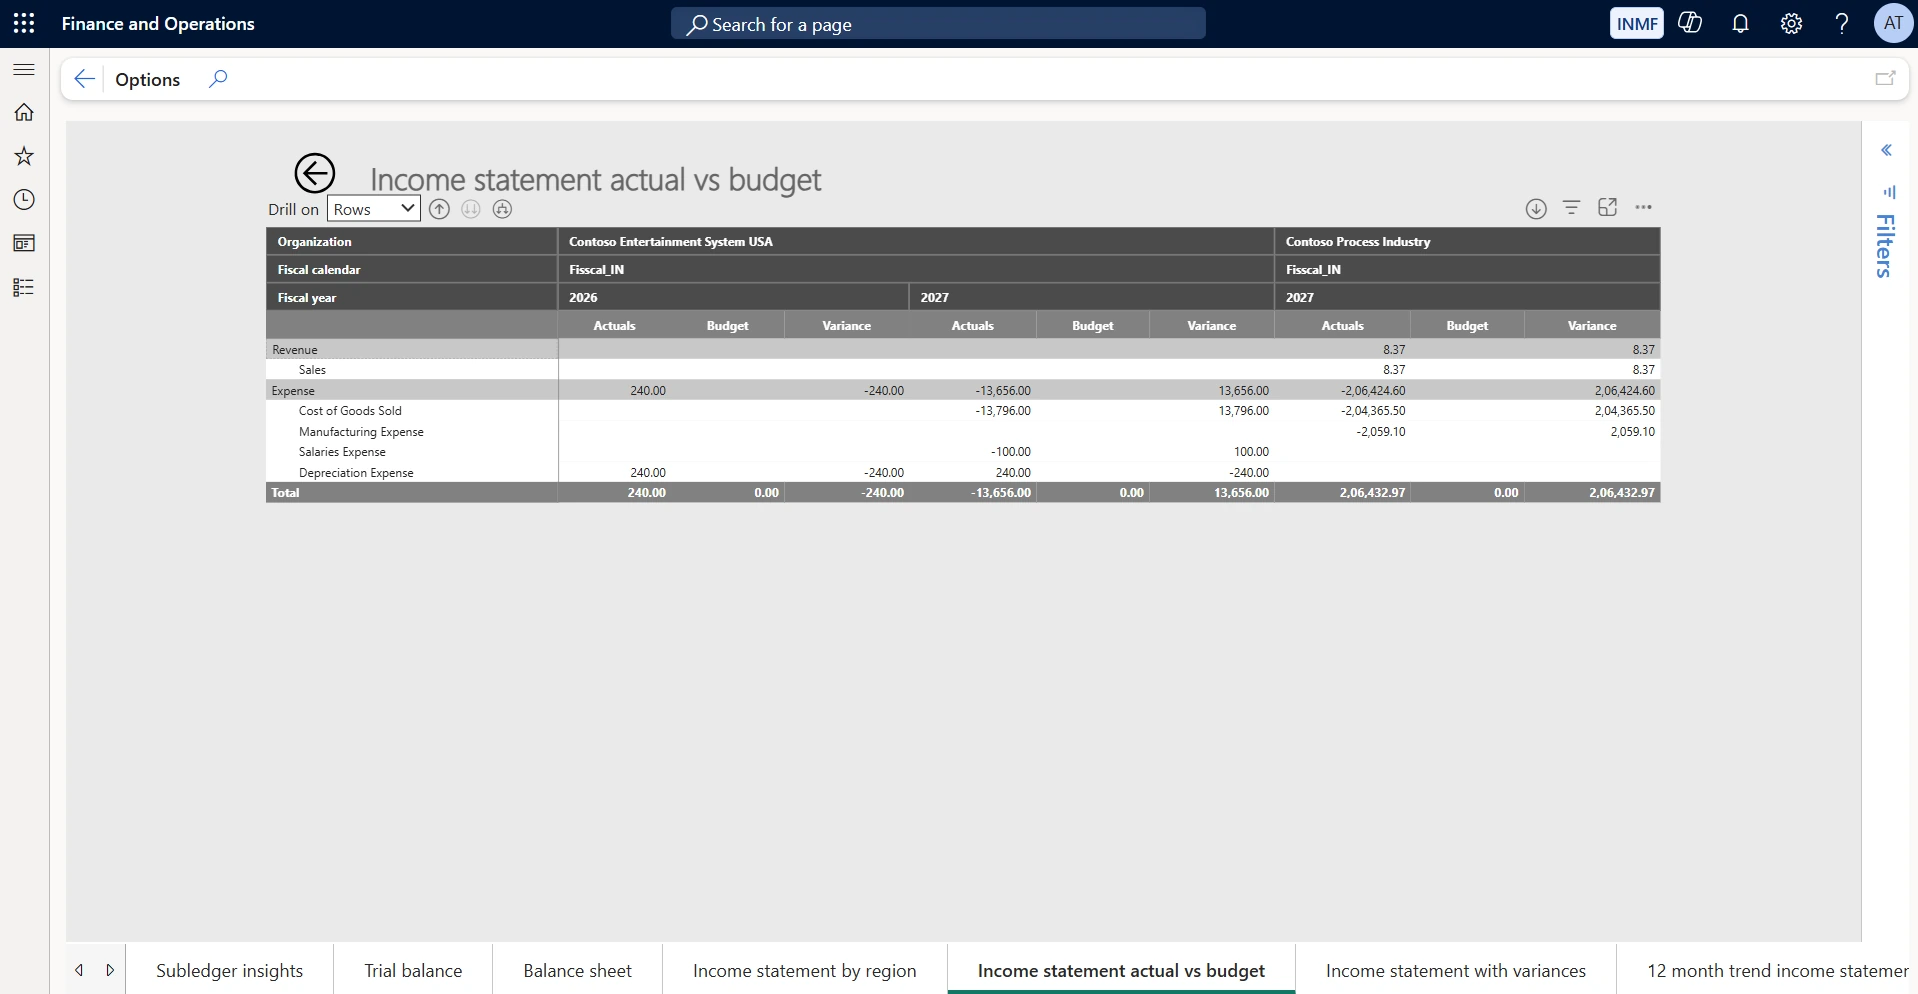
Income statement actual vs budget
Shows actuals, budget and variance by account category, with a drill-on control that pivots the view by rows or by columns. Use it in budget review meetings to move from a summary variance to the account causing it without leaving the page.
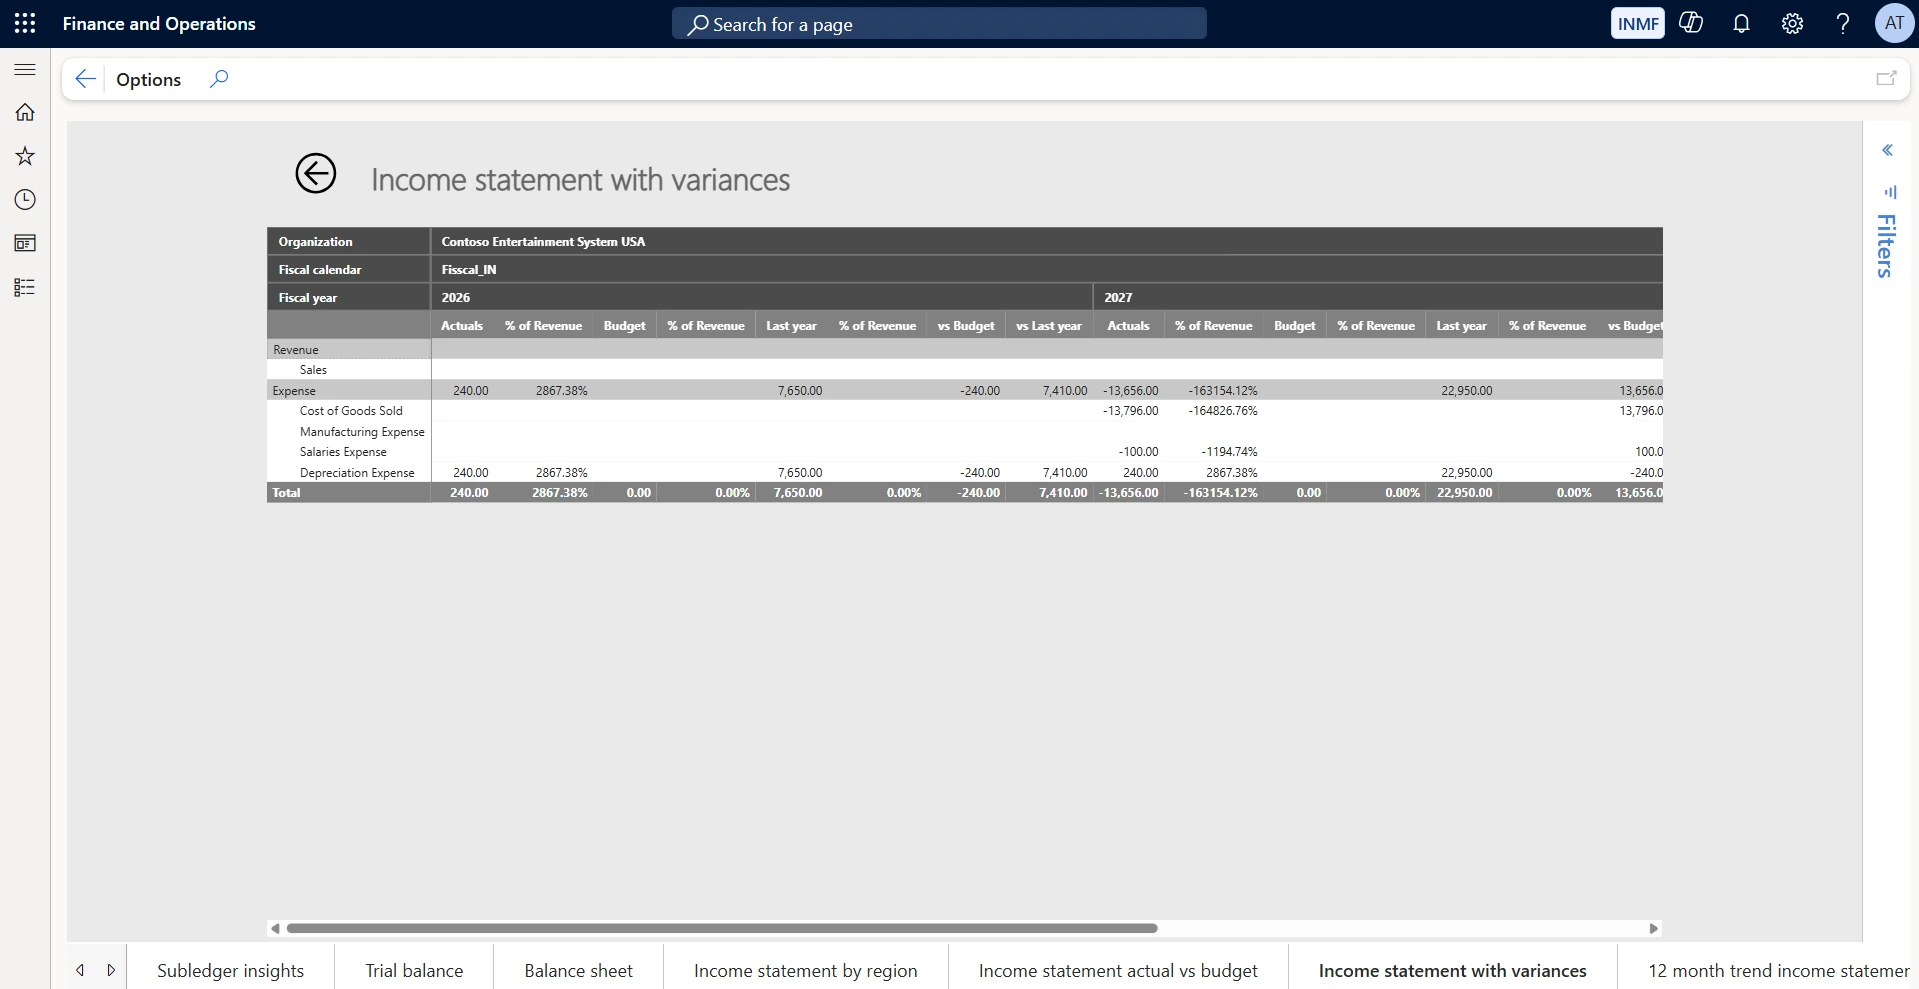
Income statement with variances
Shows each figure expressed as a percentage of revenue and compared against both budget and last year in the same grid. Use it when absolute values are misleading — common-size percentages make cost ratios comparable between entities of very different size.
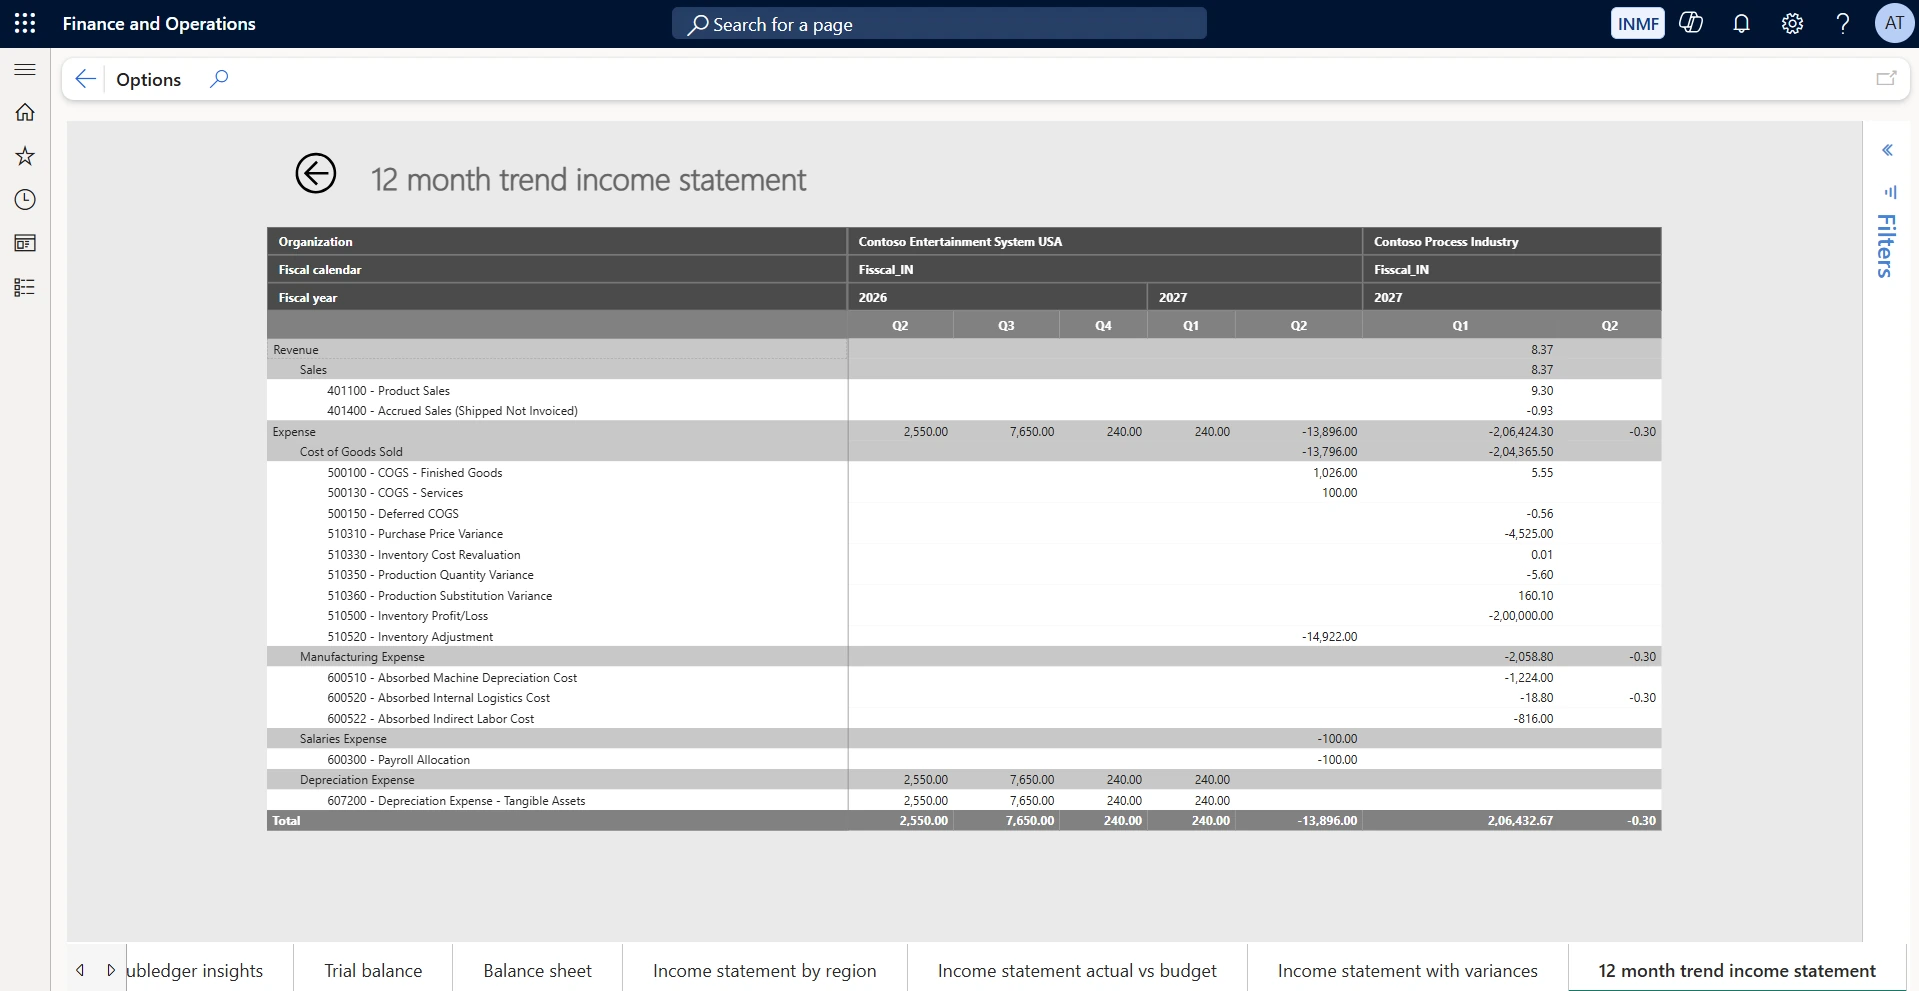
12 month trend income statement
Shows the same account hierarchy spread across fiscal quarters so movement between periods is visible in one view. Use it to spot seasonality and one-off spikes, and to sense-check a forecast against how the account has actually behaved over the year.
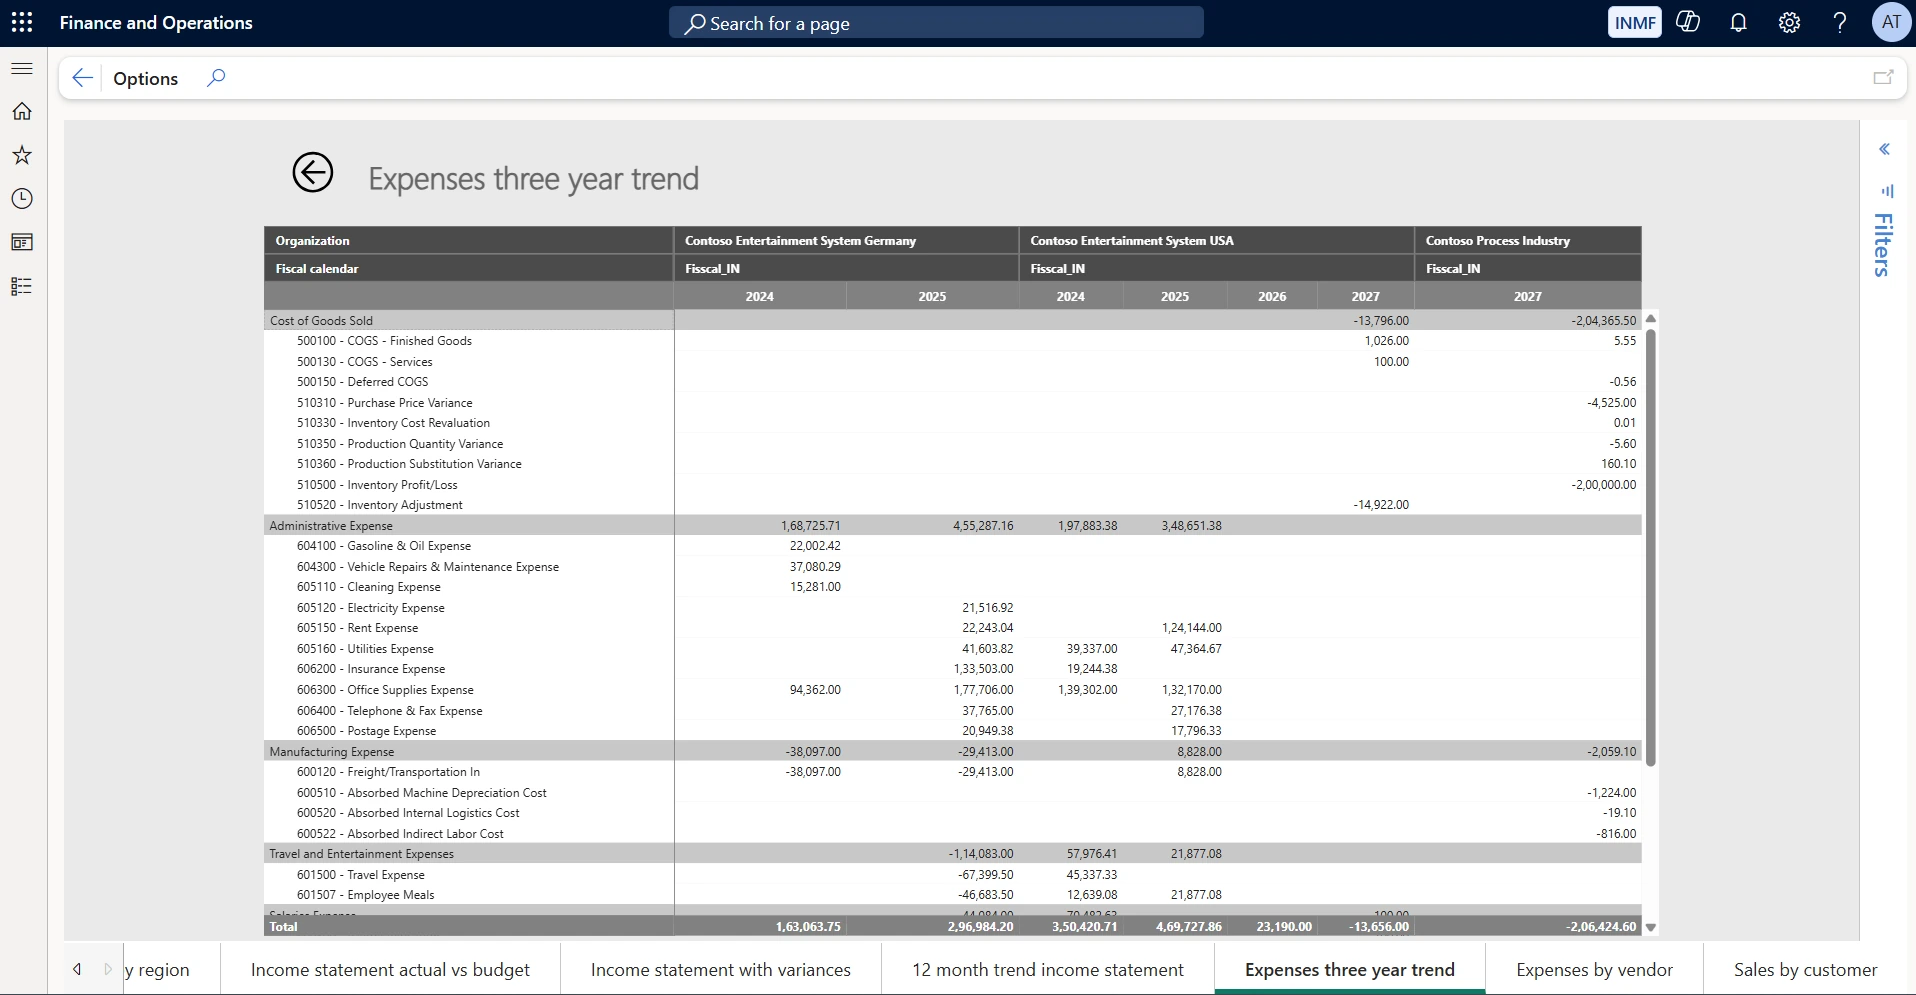
Expenses three year trend
Shows expense accounts grouped by category — administrative, manufacturing, travel and entertainment, salaries — across three fiscal years for each entity. Use it for cost-control and budgeting discussions, where a three-year run gives a far better baseline than a single year of actuals.
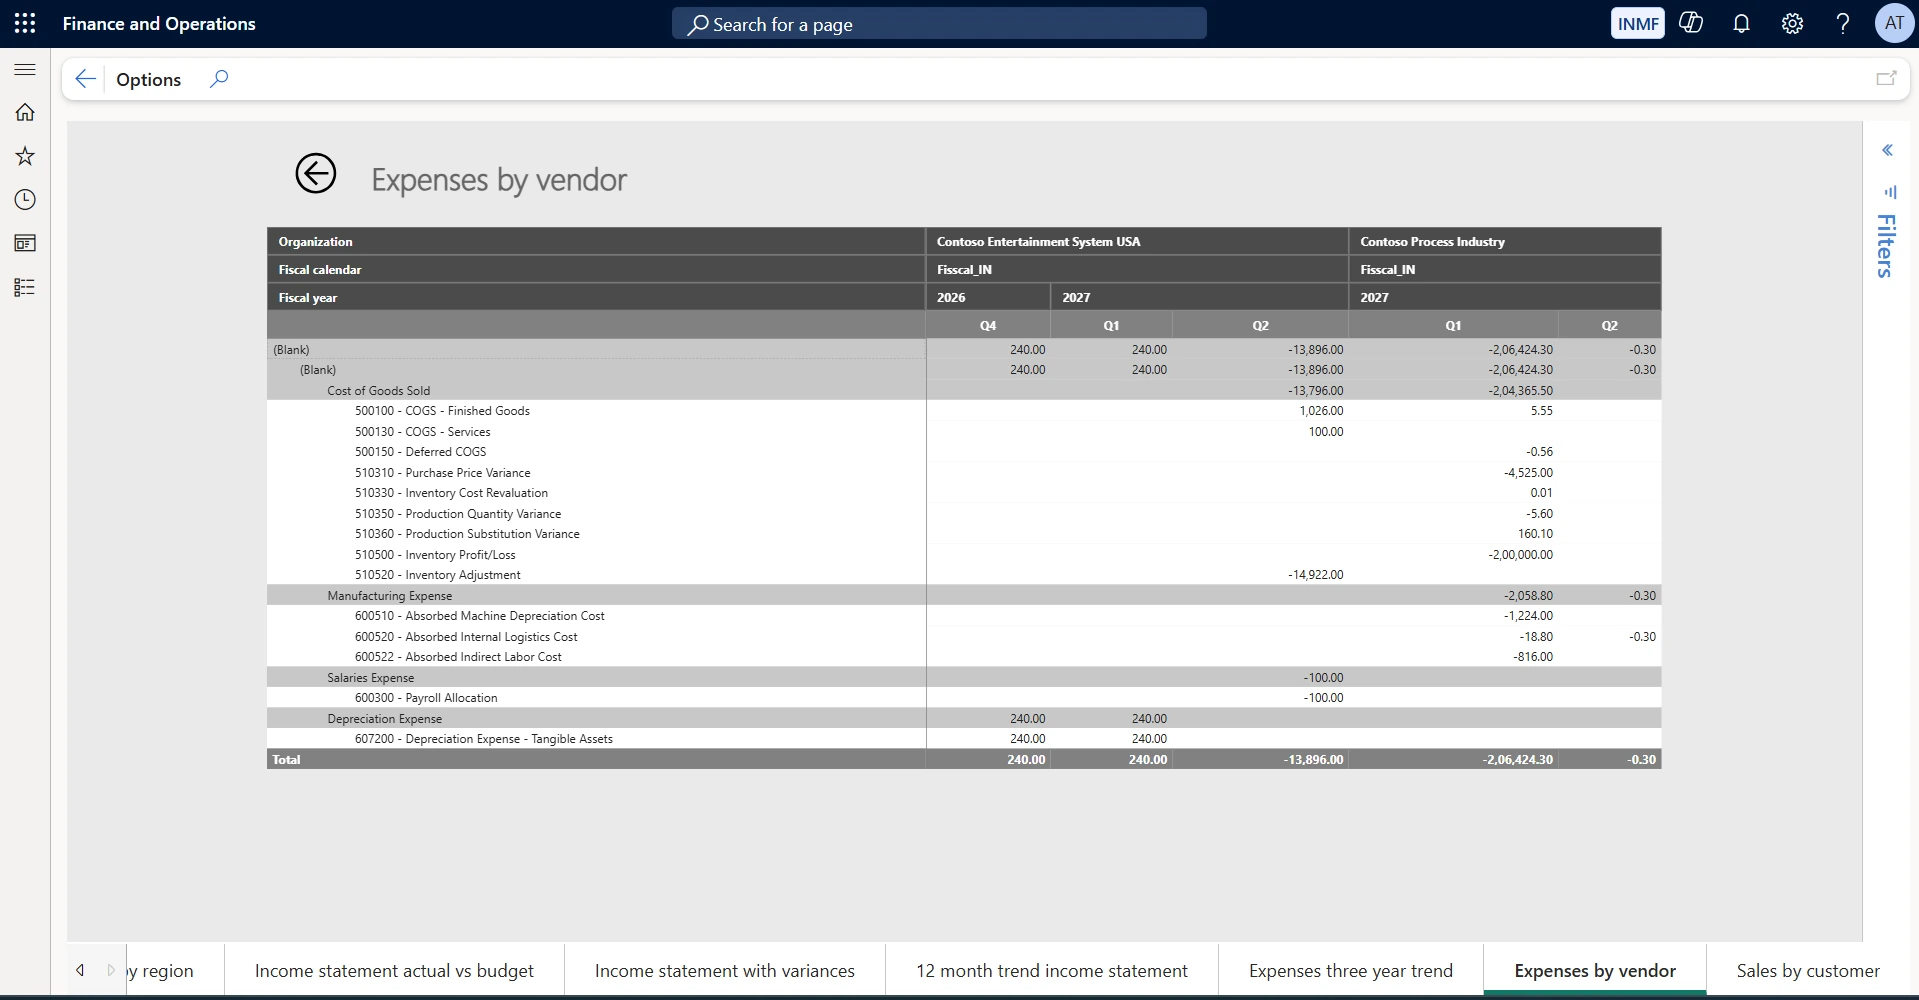
Expenses by vendor
Shows the expense account hierarchy broken out by vendor and fiscal quarter. Use it for spend consolidation and vendor negotiation — it identifies where spend is concentrated and which suppliers carry enough volume to justify renegotiated terms.
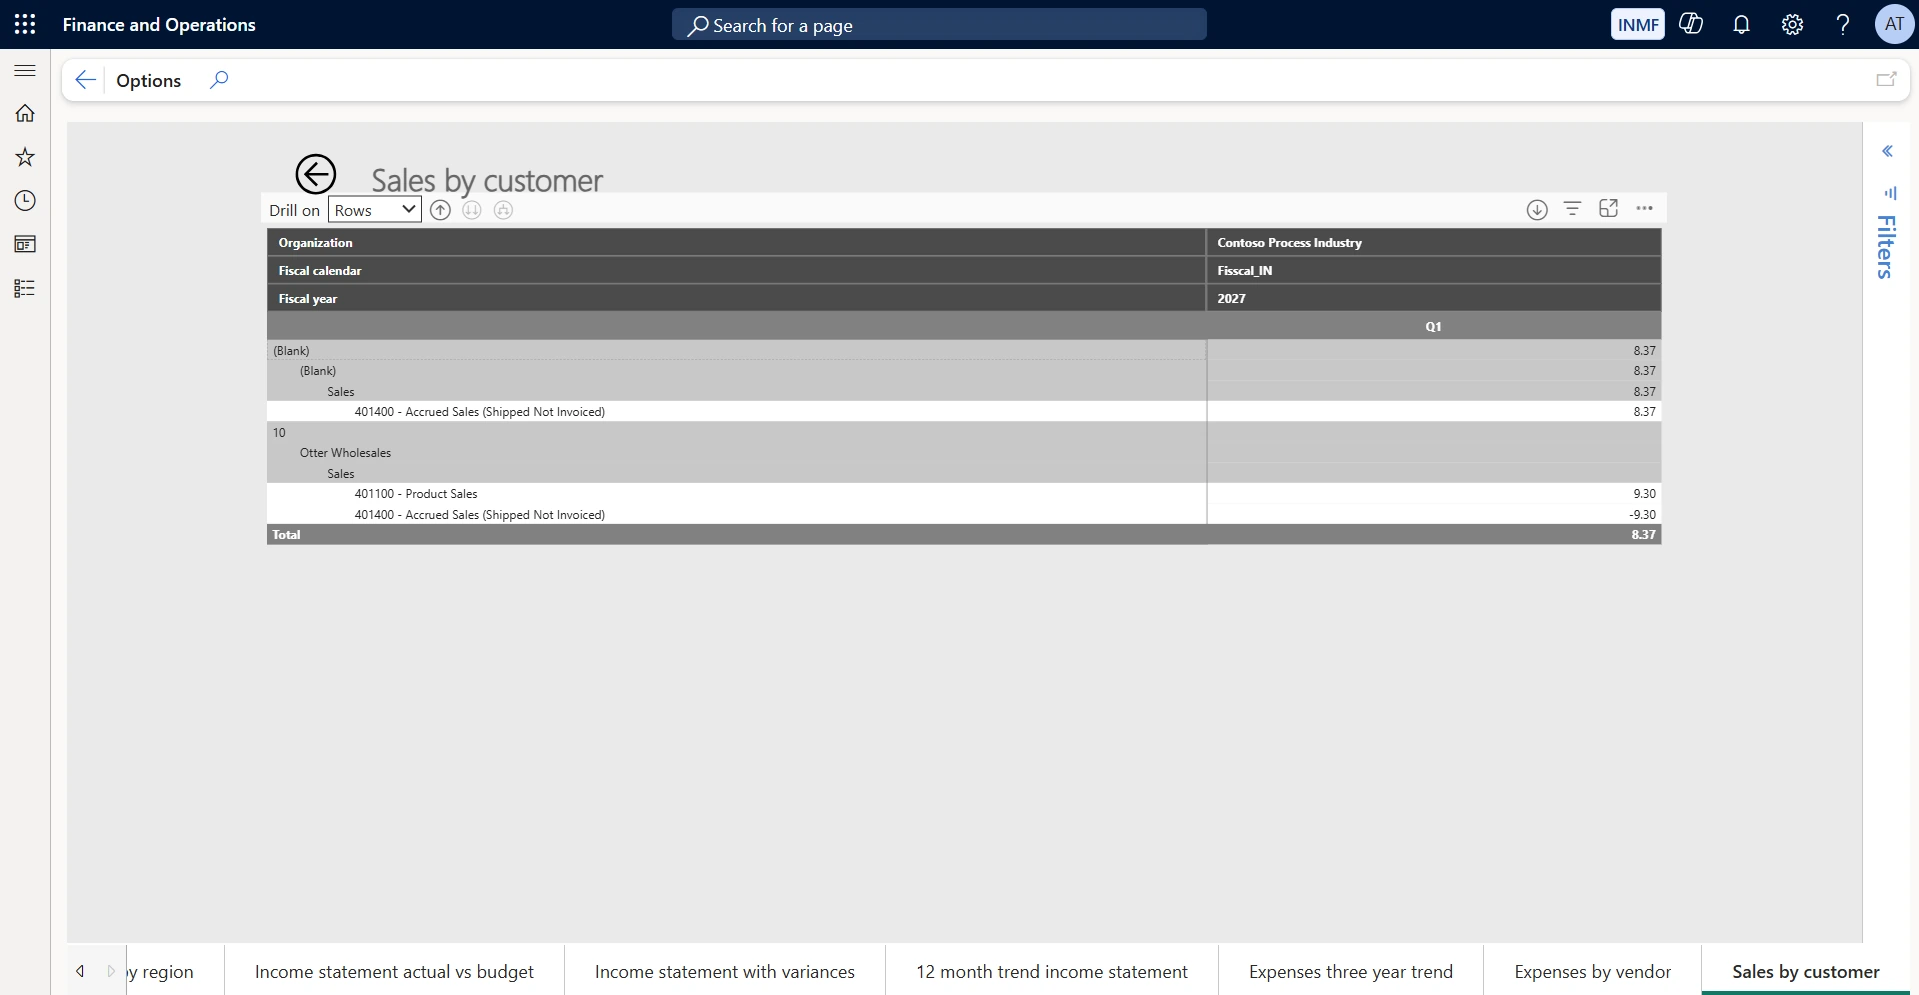
Sales by customer
Shows revenue accounts attributed to individual customers for the selected fiscal period. Use it to review customer concentration and to check that revenue recognition — including accrued or shipped-not-invoiced lines — is landing against the right accounts.
Key metrics & tiles | • Financial overview: current ratio, working capital, gross margin, debt to total assets, cost of goods sold and EBIT • Revenue and expense insights: revenue, expenses, gross margin, gross margin percentage, net income and EBIT • Trial balance, balance sheet and income statement, each carrying current year, last year and variance columns per legal entity • Three-year expense trend, expenses by vendor and sales by customer • Twelve-quarter trend view and actual-versus-budget variance in both value and percentage-of-revenue terms |
Typical actions & lists | • Move between the twelve report pages using the tab strip at the foot of the workspace • Filter by legal entity, fiscal calendar and fiscal year — each is a column header on the statement pages • Drill on rows or columns from a statement line to the accounts and transactions behind it • Open the Filters pane to apply page-level filters, or expand a page to full screen |
Who uses it | • CFOs and controllers (cross-company view, restricted by security duty) • Financial analysts and accountants (current-company view by default) |
Why it matters to leadership: This is the fastest route from a boardroom question ("how is margin trending?", "what does our liquidity position look like?") to a defensible, drillable answer — without waiting on a formal reporting cycle. It complements, but does not replace, the statutory statements produced through Financial Reporting.
Vendor invoice workspace
Module area: Accounts payable
Rather than presenting every open vendor invoice, this area is organized around the stages an invoice passes through — capture, manual entry, automated matching, workflow approval, and posting — so staff attention goes to invoices that are stuck or exception-flagged, not the ones already moving normally.
Two related workspaces share this design. Vendor invoice entry is the working queue for invoices keyed or received manually, and Vendor invoice automation tracks invoices arriving through automated import and matching. Both pair a summary of unposted work with a "Documents not invoiced" list so a clerk can see what is outstanding and act on it from the same page.
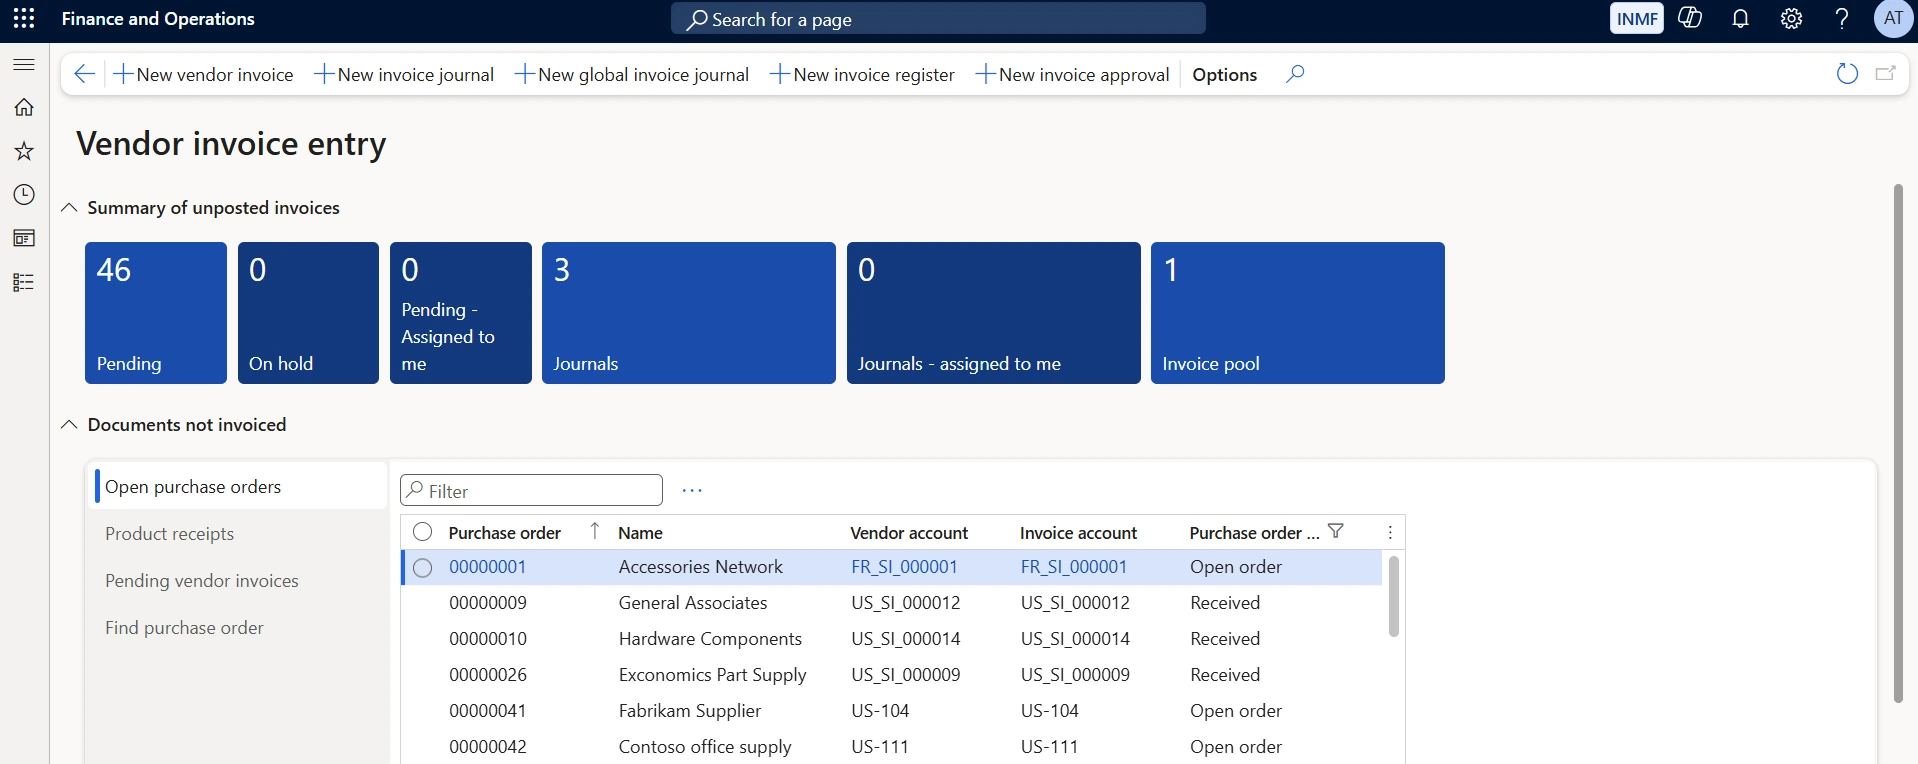
Vendor invoice entry
Shows a summary of unposted invoices — pending, on hold, pending assigned to me, journals, journals assigned to me and invoice pool — above the documents not yet invoiced, filtered here to open purchase orders. Use it as the AP clerk’s daily queue: work the exception tiles first, then use the Documents not invoiced tabs to find the purchase orders and product receipts still waiting to be billed.
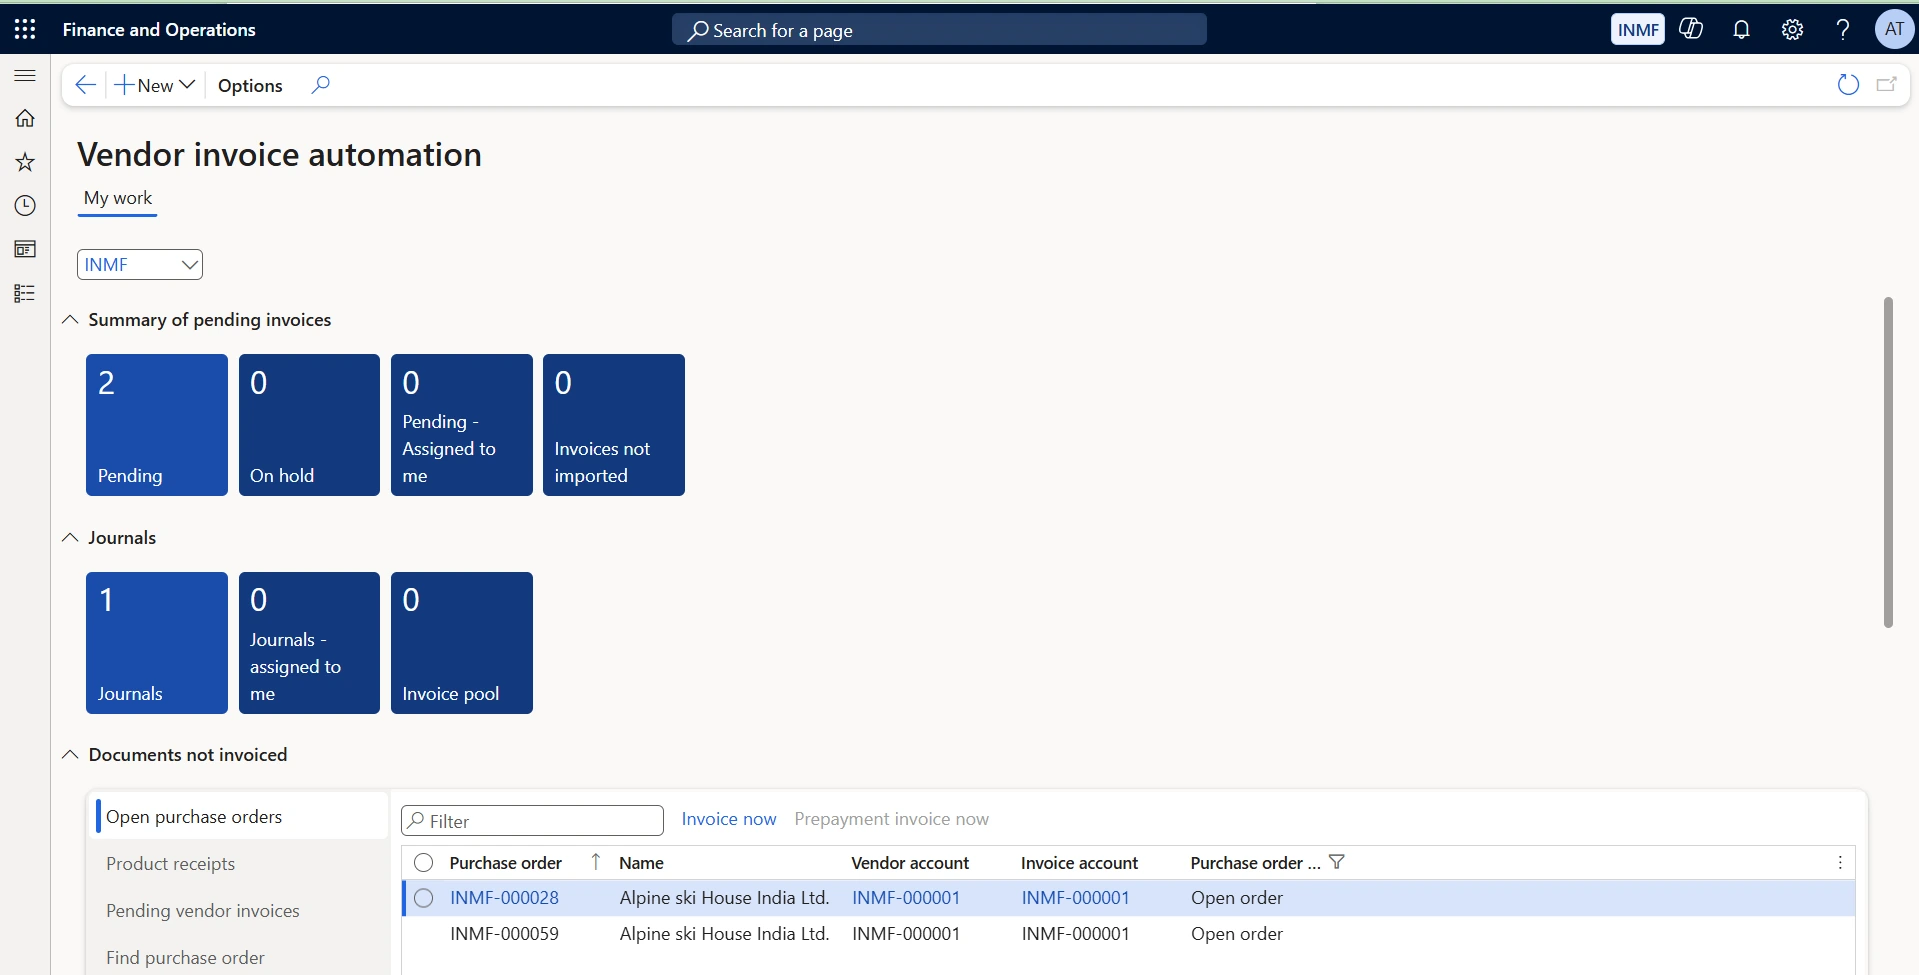
Vendor invoice automation
Shows the same structure for invoices arriving through automated import: pending and on-hold invoices, invoices not imported, journals and invoice pool, with a per-company filter and "Invoice now" and "Prepayment invoice now" actions on the open purchase order list. Use it to supervise touchless processing — the "invoices not imported" tile is the early warning that the inbound feed has failed.
Key metrics & tiles | • Vendor invoice entry: pending, on hold, pending assigned to me, journals, journals assigned to me, and invoice pool • Vendor invoice automation: pending, on hold, pending assigned to me, and invoices not imported • Documents not invoiced, split into open purchase orders, product receipts and pending vendor invoices • Invoices with import, validation or workflow errors, and invoices complete but not yet posted |
Typical actions & lists | • Create a vendor invoice, invoice journal, global invoice journal, invoice register or invoice approval from the action pane • Invoice an open purchase order, or raise a prepayment invoice, without leaving the workspace • Include or exclude invoices from touchless automation; accept minor price discrepancies • Search for a purchase order, product receipt or pending invoice; review posted invoice history and vendors placed on hold |
Who uses it | • Accounts payable managers • Accounts payable clerks |
Why it matters to leadership: Exception-based processing shortens the invoice-to-pay cycle and reduces the manual effort needed to keep AP current, which in turn protects early-payment discounts and vendor relationships.
Vendor payments workspace
Module area: Accounts payable / Cash and bank management
This workspace centres on the payment side of the AP cycle: building payment runs, tracking overdue obligations, and monitoring settlement. A My work tab carries the operational payment journals and pay-run status, while the Analytics tab presents eight report pages — Vendor payments overview, Invoices past due, Invoices due today, Invoices due in future, Discounts taken to discounts lost, Invoices paid late, Payment workflow, and Vendor totals.
Vendor payments overview
Shows invoices and amount past due, invoices and amount due today, with panels for invoices due in future, paid-late against paid-on-time, discounts taken against discounts lost, open invoices on payment hold and payment workflow assignment. Use it to plan a payment run — the cash discount panel shows what is worth paying early, while the hold panel shows what must not be paid at all.
Invoices past due
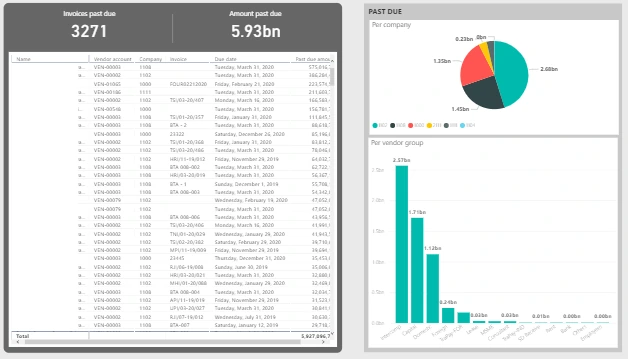
Shows the overdue invoice list with past due amounts broken down by company and by vendor group. Use it to prioritise which overdue balances to clear first, and to identify whether arrears are concentrated in one entity or one category of supplier.
Invoices paid late
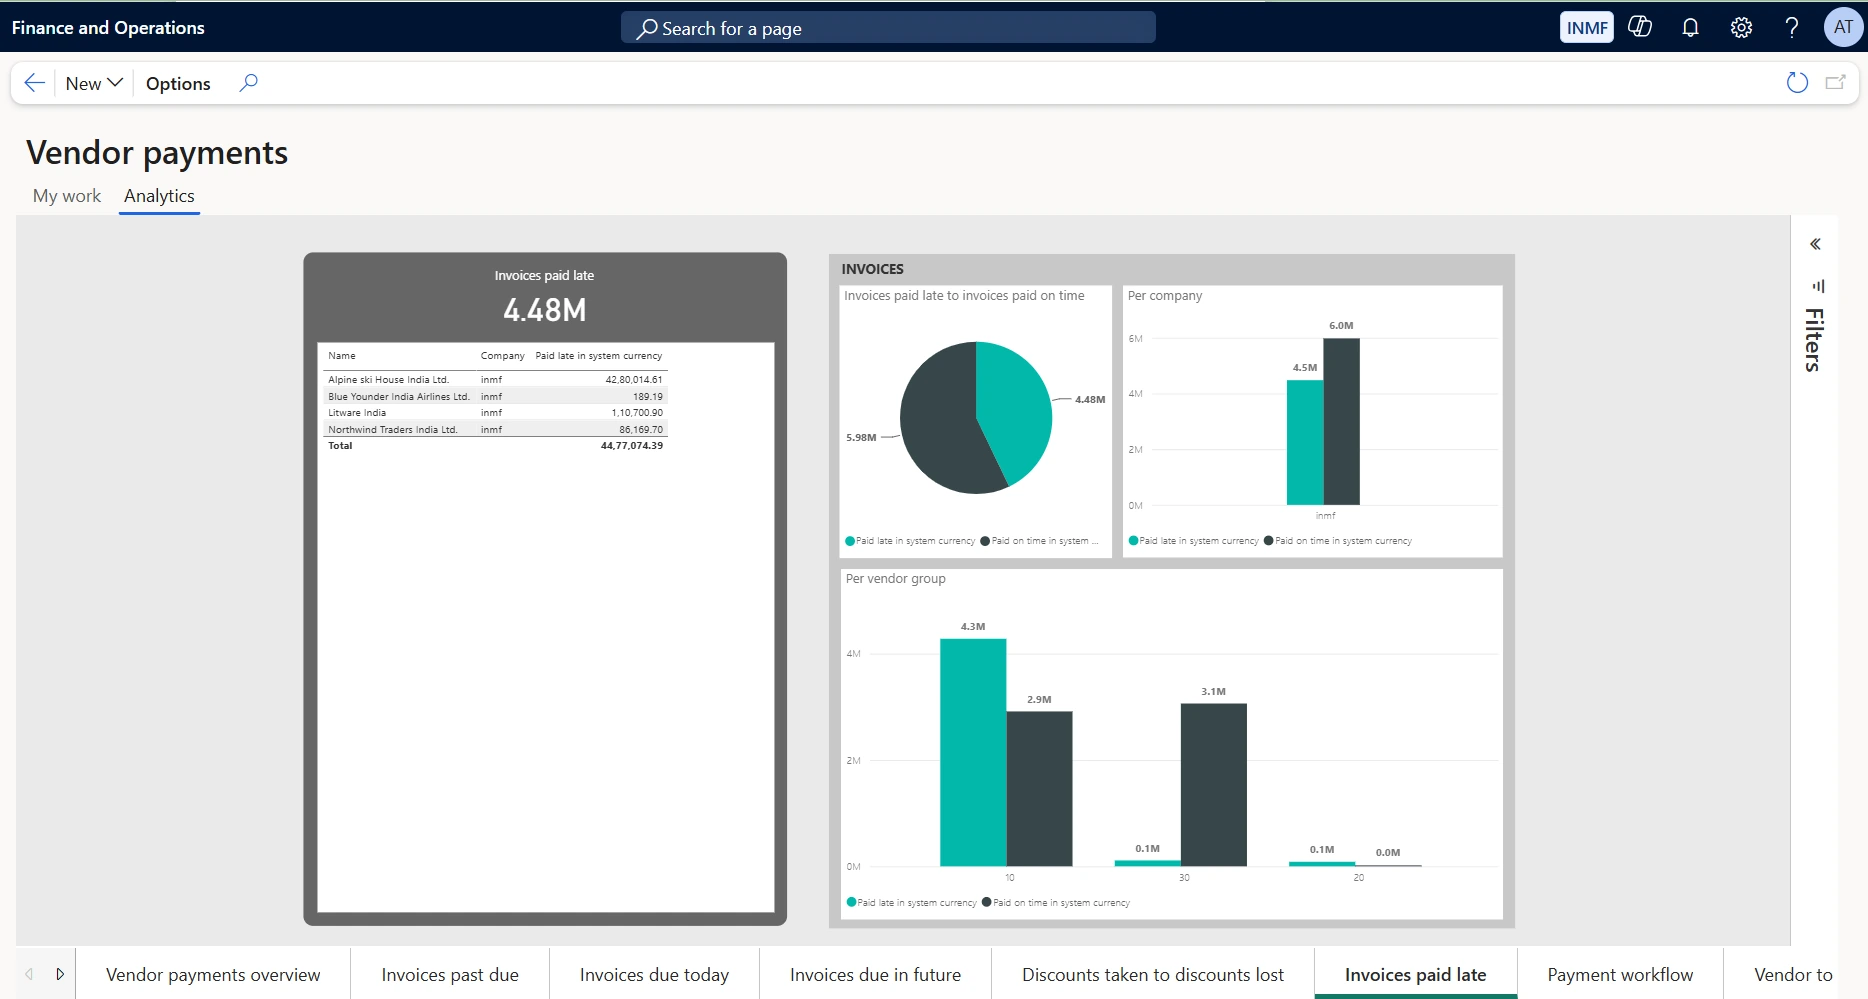
Shows the total value paid late — 4.48M against 5.98M paid on time — with the vendor-level breakdown beside the same comparison per company and per vendor group. Use it to measure payment performance against agreed terms: the vendor list identifies which relationships are absorbing the delay, and the vendor group chart shows whether lateness is a systemic process problem or concentrated in one category of supplier.
Discounts taken to discounts lost
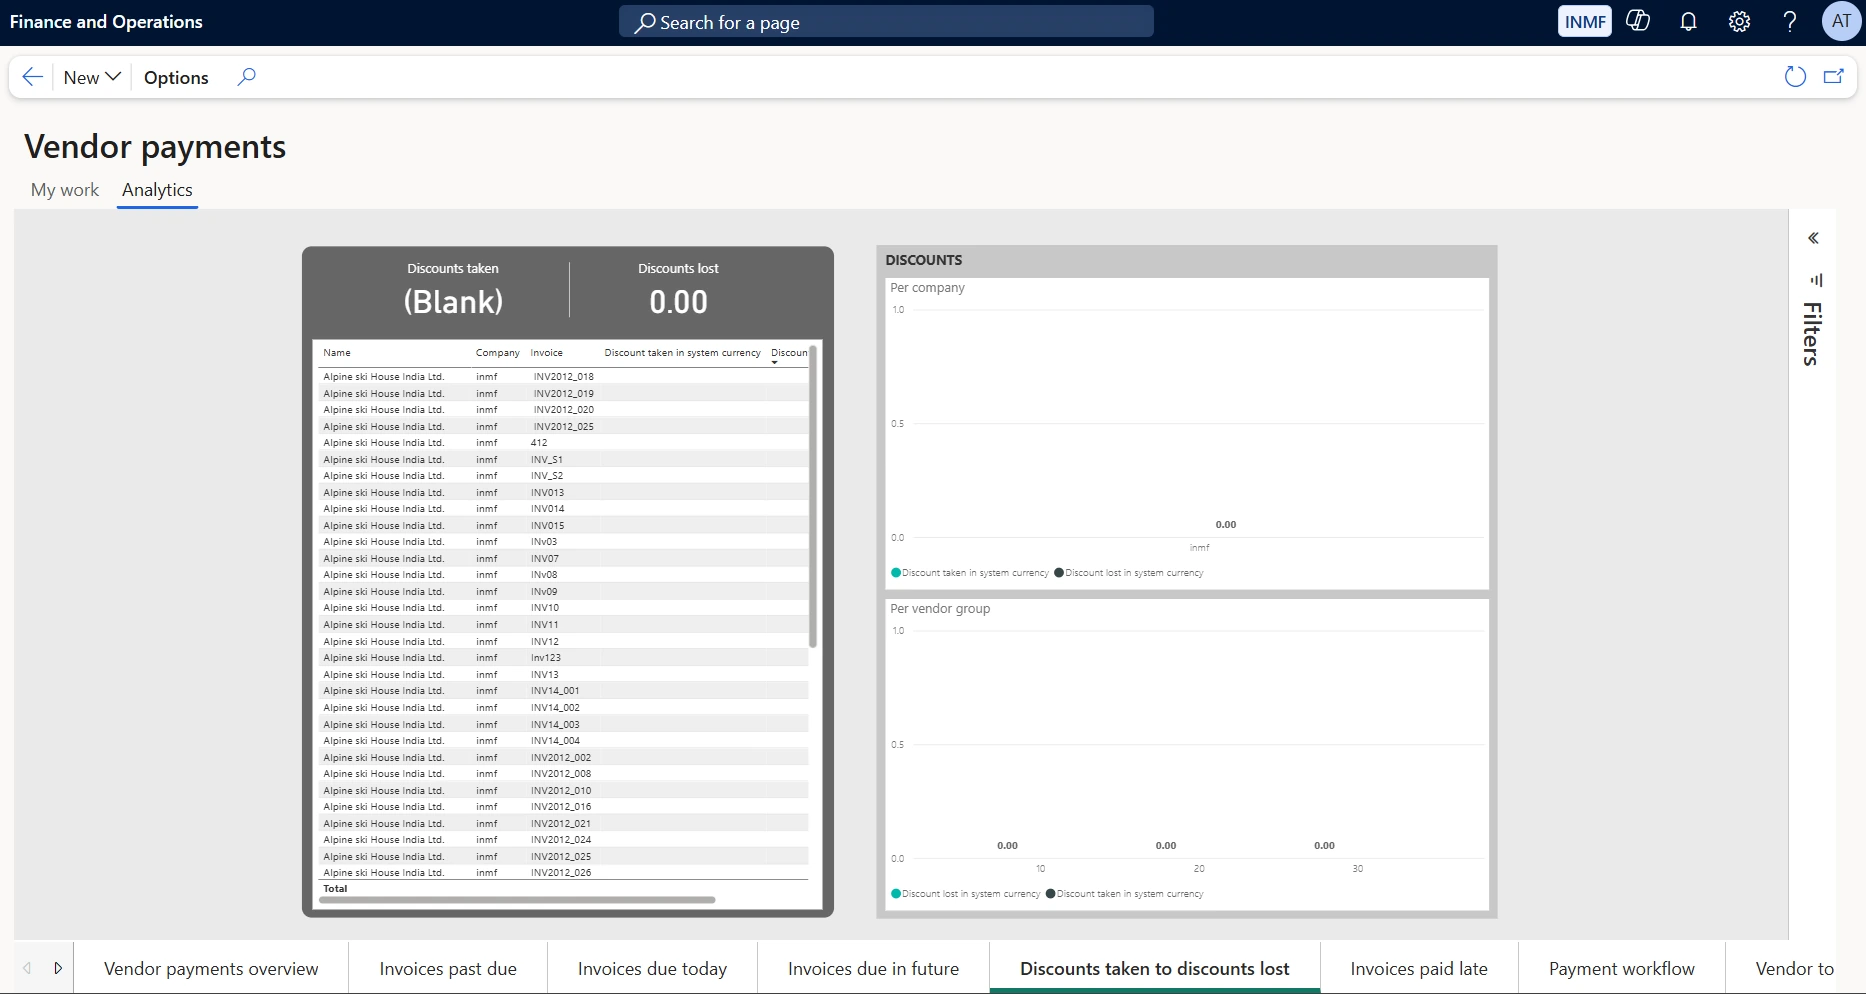
Shows the value of early-payment discounts actually captured against those forfeited, with the invoice-level detail beside the split per company and per vendor group. Use it to put a number on what slow payment is costing — every figure in the "discounts lost" column is margin the business was entitled to and did not take. Note that both measures stay blank until cash discount terms are configured on the vendor payment terms, as in the environment shown here.
Key metrics & tiles | • Invoices past due and amount past due; invoices due today and amount due today • Invoices due in future, by cash discount date and by due date • Invoices paid late against invoices paid on time, per company and per vendor group • Discounts taken against discounts lost, and open invoices with a payment hold • Payment workflow assignment, and vendor-customer netting balances |
Typical actions & lists | • Switch between My work (payment journals, pay-run status) and the Analytics report pages • Move between the eight analytics pages using the tab strip at the foot of the workspace • Search and filter vendor transactions and settlement history • Review payment workflow status and organizational/company-level payment permissions |
Who uses it | • Centralized payment clerks and treasury staff • Accounts payable managers |
Why it matters to leadership: Gives finance leadership direct visibility into cash outflow commitments and days payable outstanding (DPO), supporting working-capital decisions such as when to take early-payment discounts versus preserve cash.
Vendor collaboration invoicing workspace
Module area: Accounts payable — external vendor self-service portal
A portal-facing workspace that vendors use directly to submit and track their own invoices, rather than emailing AP and waiting for a status update.
Key metrics & tiles | • Draft • Submitted but not yet approved • Approved but not yet paid • Paid |
Typical actions & lists | • Create an invoice from a purchase order (lines auto-populate) or a non-PO invoice for approved categories • Attach supporting files and notes, and submit directly into the approval workflow |
Who uses it | • External vendors (self-service) • Accounts payable staff (oversight) |
Why it matters to leadership: Moves data entry and status inquiries onto the vendor, cutting AP administrative load and “where is my payment” calls, while keeping every submission inside the same governed approval workflow.
Collections coordinator workspace
Module area: Accounts receivable — credit and collections
The day-to-day working view for a collection’s agent: open tasks, the highest-balance accounts, and aged receivables, together with customer history and AI-assisted drafting of collection correspondence where enabled.
Key metrics & tiles | • Open collections activities, sorted by oldest due date • Highest 100 customer balances with credit limit, available credit and risk score • Aged balances by customer credit group and account status |
Typical actions & lists | • Review disputed invoices, promised-to-pay commitments and unsettled payments • View a rolling 365-day customer timeline of invoices, payments, letters and activities • Draft reminder emails and update account status, write-offs or settlements |
Who uses it | • Collections agents and coordinators |
Why it matters to leadership: Concentrates collector effort on the accounts that carry the most risk and value, and speeds dispute resolution — both of which move the needle on days sales outstanding (DSO) and bad-debt exposure.
Customer invoicing workspace
Module area: Accounts receivable — order to invoice
The operational front end of the receivables cycle. It gathers everything waiting to be billed — sales orders shipped but not yet invoiced, free text invoices not yet posted, and recurring invoice groups — into a single queue, so revenue that has been earned does not sit un-invoiced.
Customer invoicing
Shows shipped but not invoiced sales orders, orders on hold, free text invoices assigned to me, unposted free text invoices and unposted recurring invoice groups, above the orders and invoices list. Use it to clear the billing backlog — the "shipped but not invoiced" tile is revenue already earned, and posting from this page turns it into an receivable the same day.
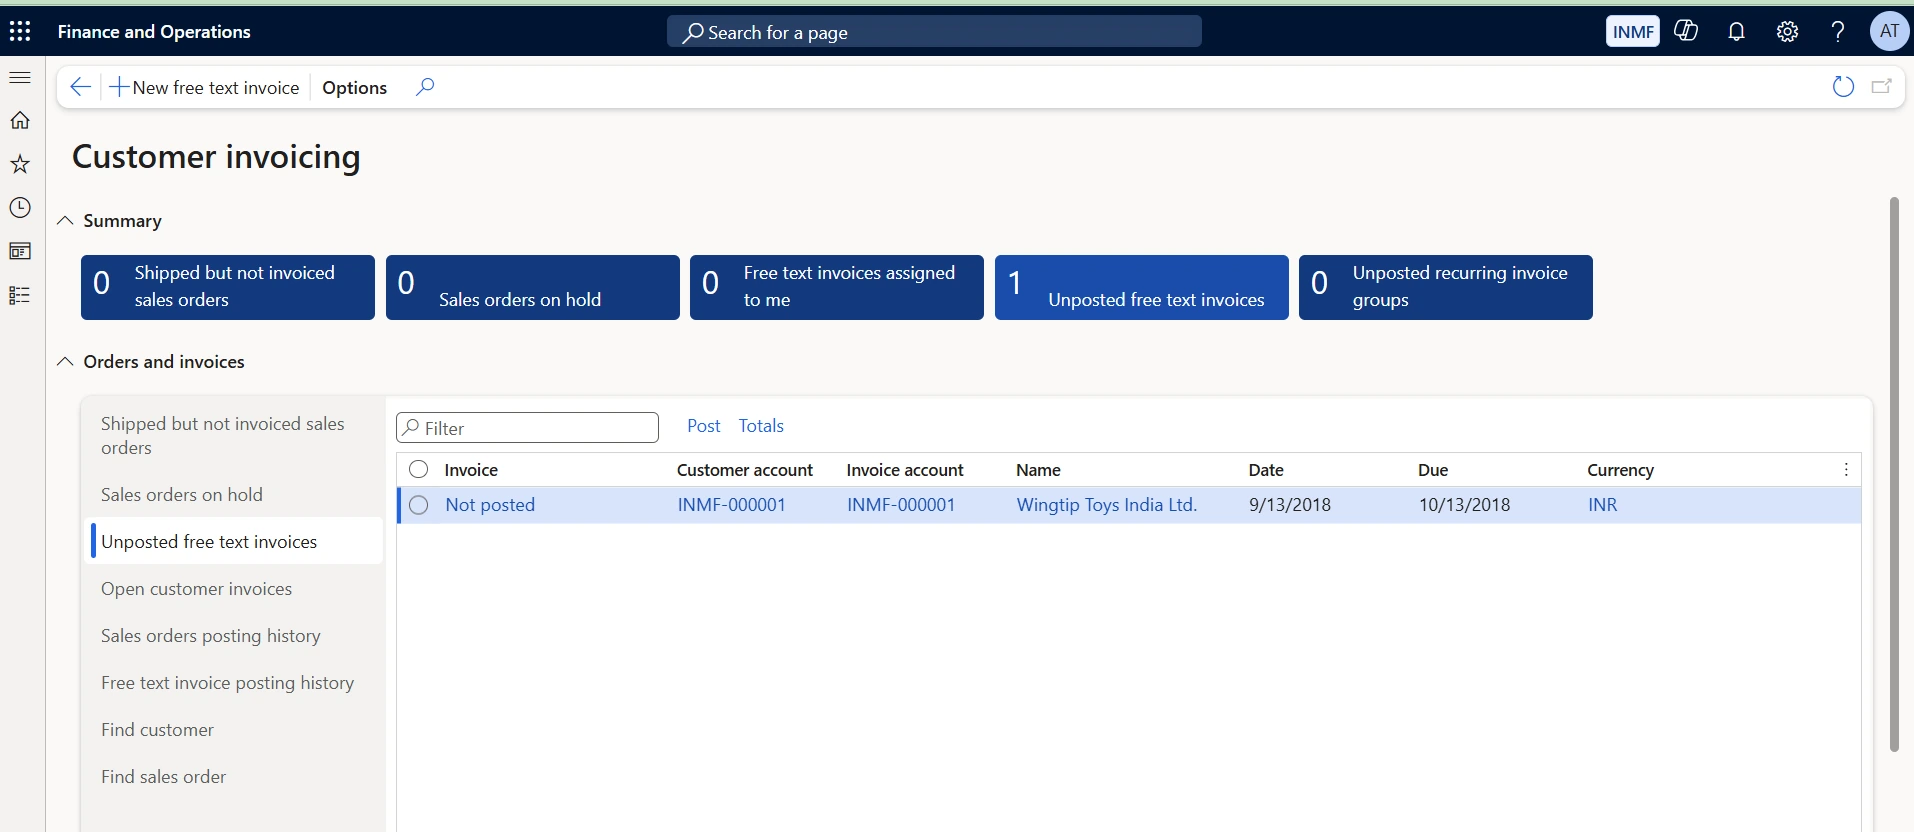
Key metrics & tiles | • Shipped but not invoiced sales orders • Sales orders on hold • Free text invoices assigned to me • Unposted free text invoices • Unposted recurring invoice groups |
Typical actions & lists | • Create a free text invoice directly from the action pane • Work the orders and invoices list by tab: shipped but not invoiced, orders on hold, unposted free text invoices, open customer invoices • Post invoices and review totals without leaving the workspace • Review sales order and free text invoice posting history, or look up a customer or sales order |
Who uses it | • Accounts receivable clerks and billing staff • Sales administrators responsible for order completion |
Why it matters to leadership: Un-billed shipments are revenue the business has earned but has not yet asked to be paid for. Surfacing them as a live count, rather than as a report someone has to remember to run, shortens the gap between delivery and invoice and feeds directly into days sales outstanding.
Customer payments workspace
Module area: Accounts receivable — cash application and settlement
Where incoming customer cash is recorded, matched and settled. The workspace pairs a summary of payment journals and customer exceptions with a transaction list focused on what is past due or still unsettled.
Customer payments
Shows record customer payment, invoices past due and due today, unposted payment journals, electronic payments awaiting bank confirmation, customers on hold, deposit slips and summarized payments, above the customer transaction list. Use it to apply incoming cash — work the unposted journals down to zero, then settle against the past-due invoices so the aging reflects reality.
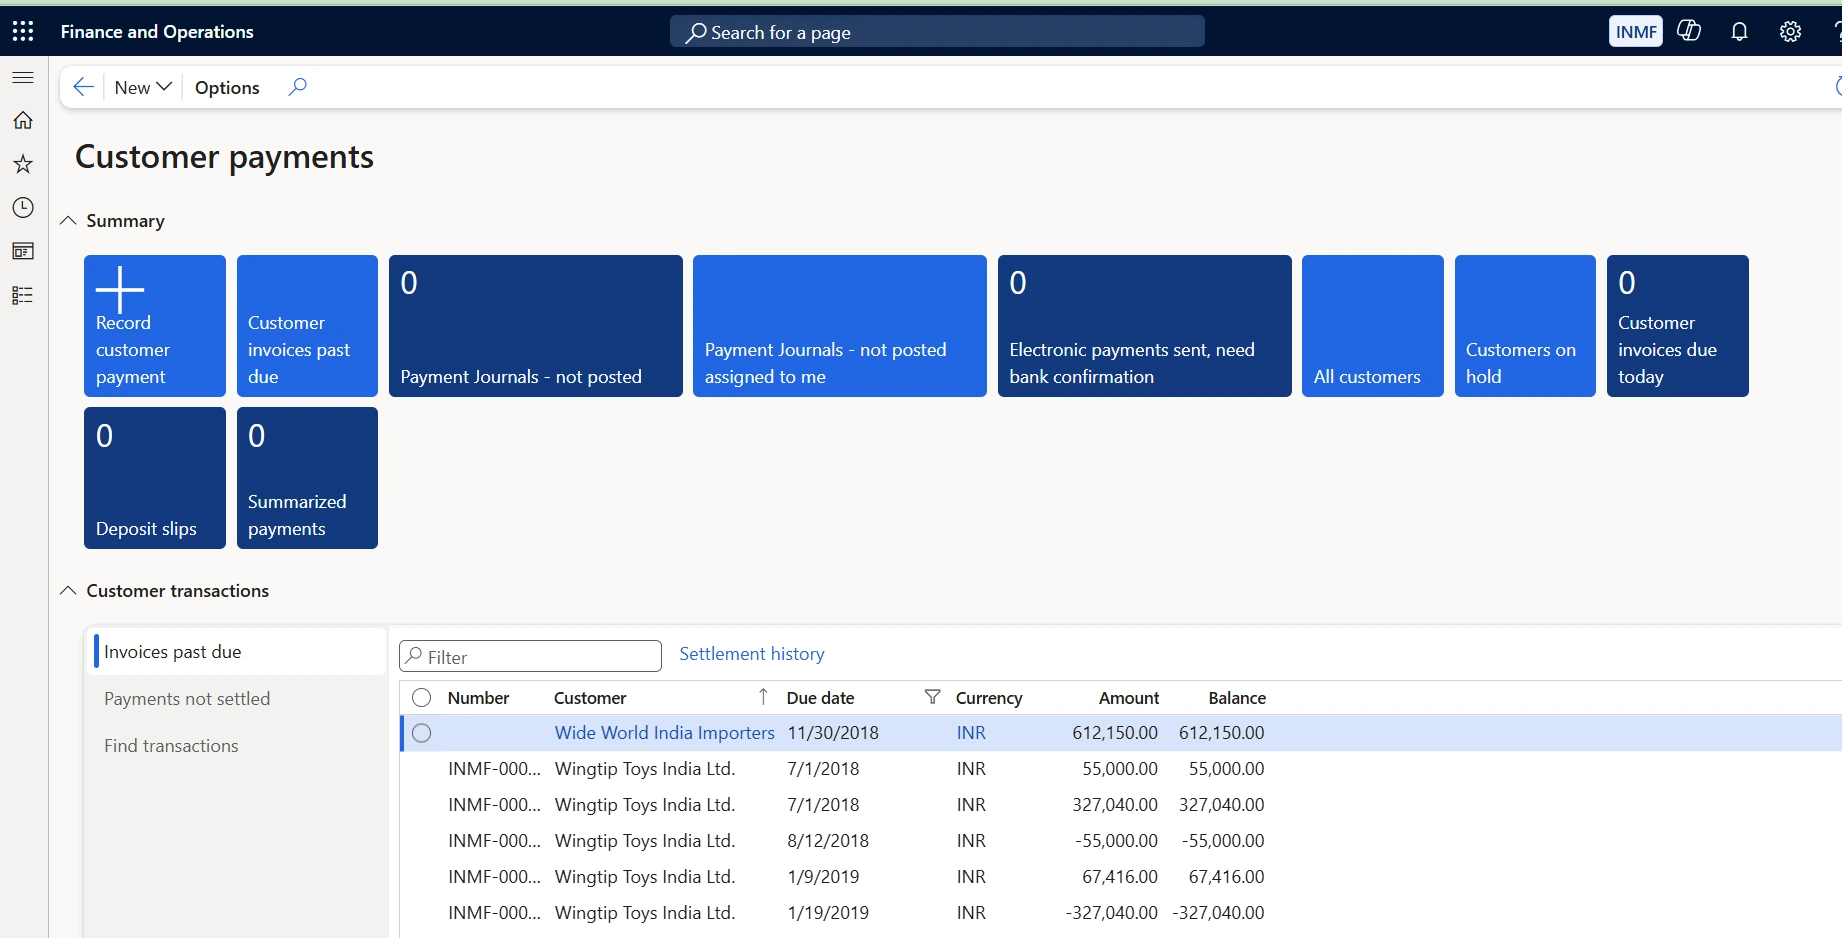
Key metrics & tiles | • Customer invoices past due, and customer invoices due today • Payment journals not posted, and those not posted but assigned to me • Electronic payments sent that still need bank confirmation • Customers on hold, deposit slips and summarized payments |
Typical actions & lists | • Record a customer payment directly from the summary tile • Work the customer transactions list by tab: invoices past due, payments not settled, find transactions • Open settlement history for any customer transaction • Review all customers, or only those placed on hold |
Who uses it | • Accounts receivable and cash application clerks • Treasury staff confirming electronic receipts |
Why it matters to leadership: Cash that has arrived but has not been applied still shows as money owed, distorting both the aging and DSO. Tracking unposted journals and unconfirmed electronic payments as live counts keeps the receivables ledger honest and shortens the lag between receipt and settlement.
Customer credit and collections workspace
Module area: Accounts receivable — credit and collections (manager analytics)
The manager-facing companion to the Collections coordinator workspace, built on Power BI-embedded reporting. This is generally the single clearest view of receivables health in the system.
The Analytics – all companies tab is organised as ten report pages: Collections overview, Credit overview, Credit limit, Customers over credit limit, Customers past due, Aged balances, Expected payments, Write-offs, Collections status and Collection letters. A Filters pane applies company, customer account and customer group across every page.
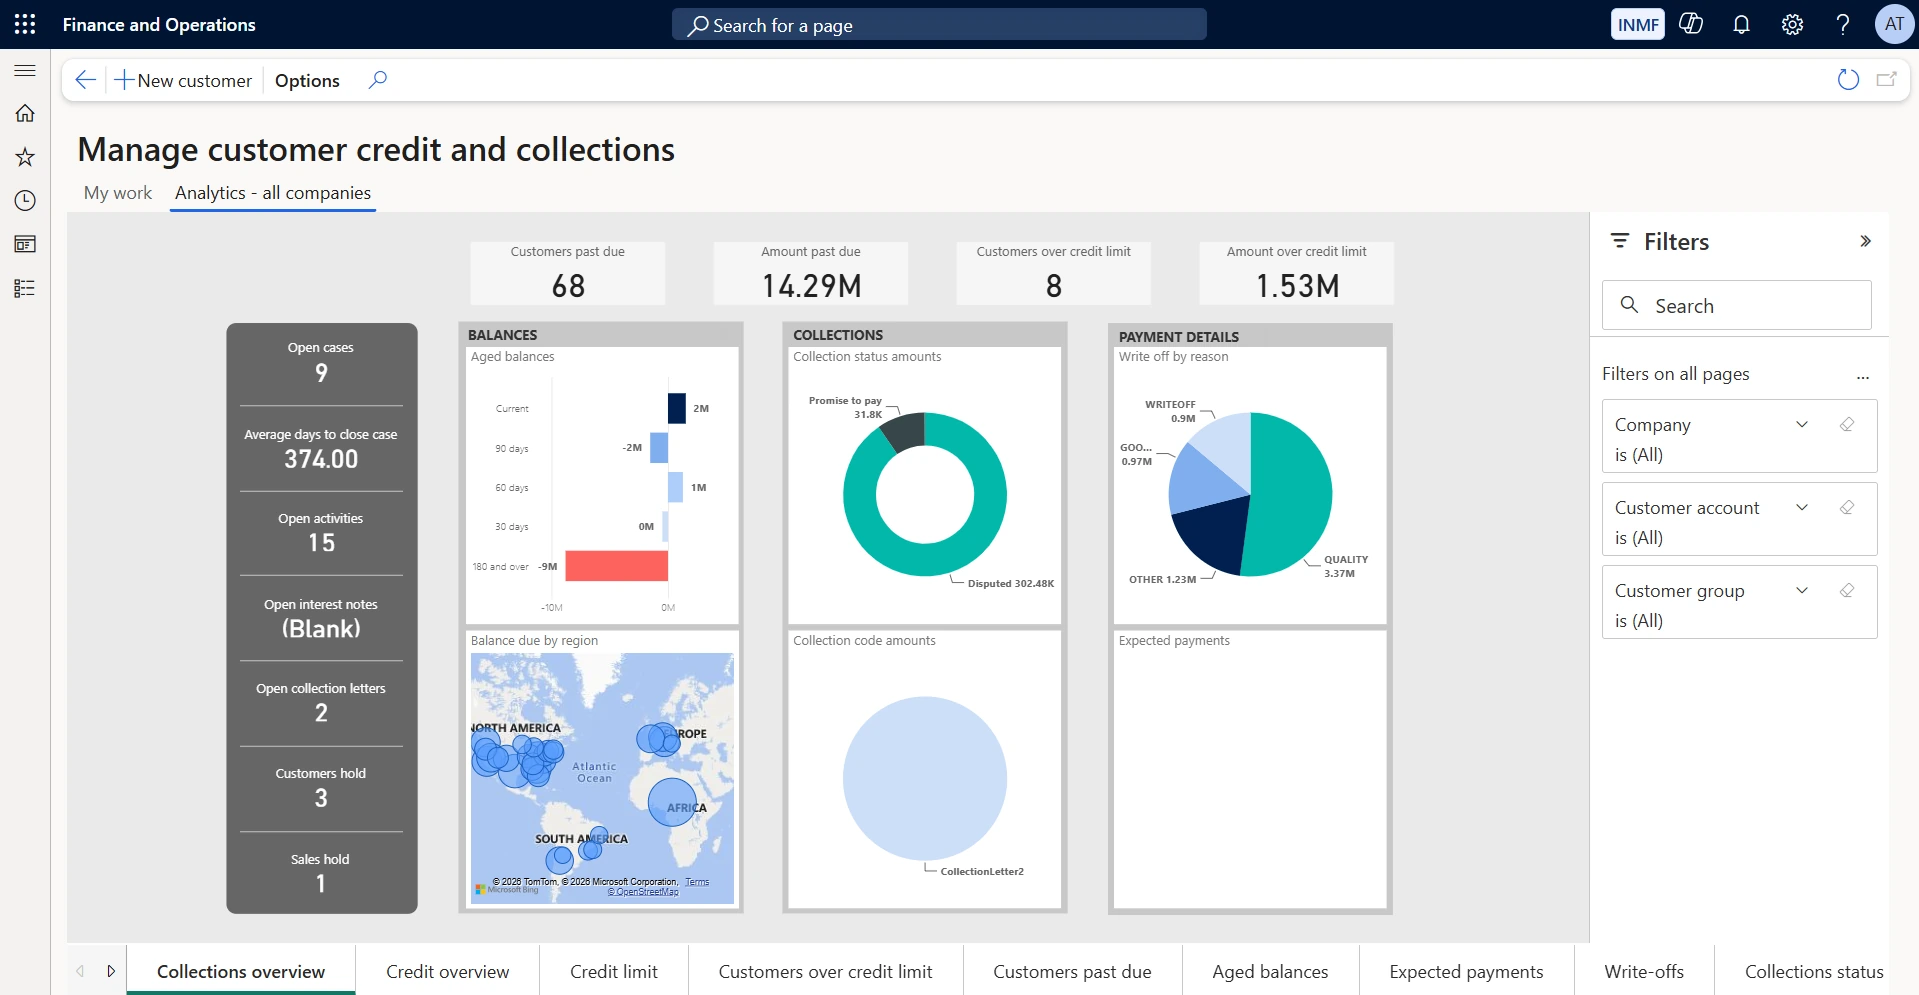
Collections overview
Shows customers and amount past due, customers and amount over credit limit, open cases and activities, aged balances, balance due by region, collection status amounts and write-offs by reason. Use it as the weekly receivables review page — it answers how much is at risk, how old it is, and what the collections team is already doing about it.
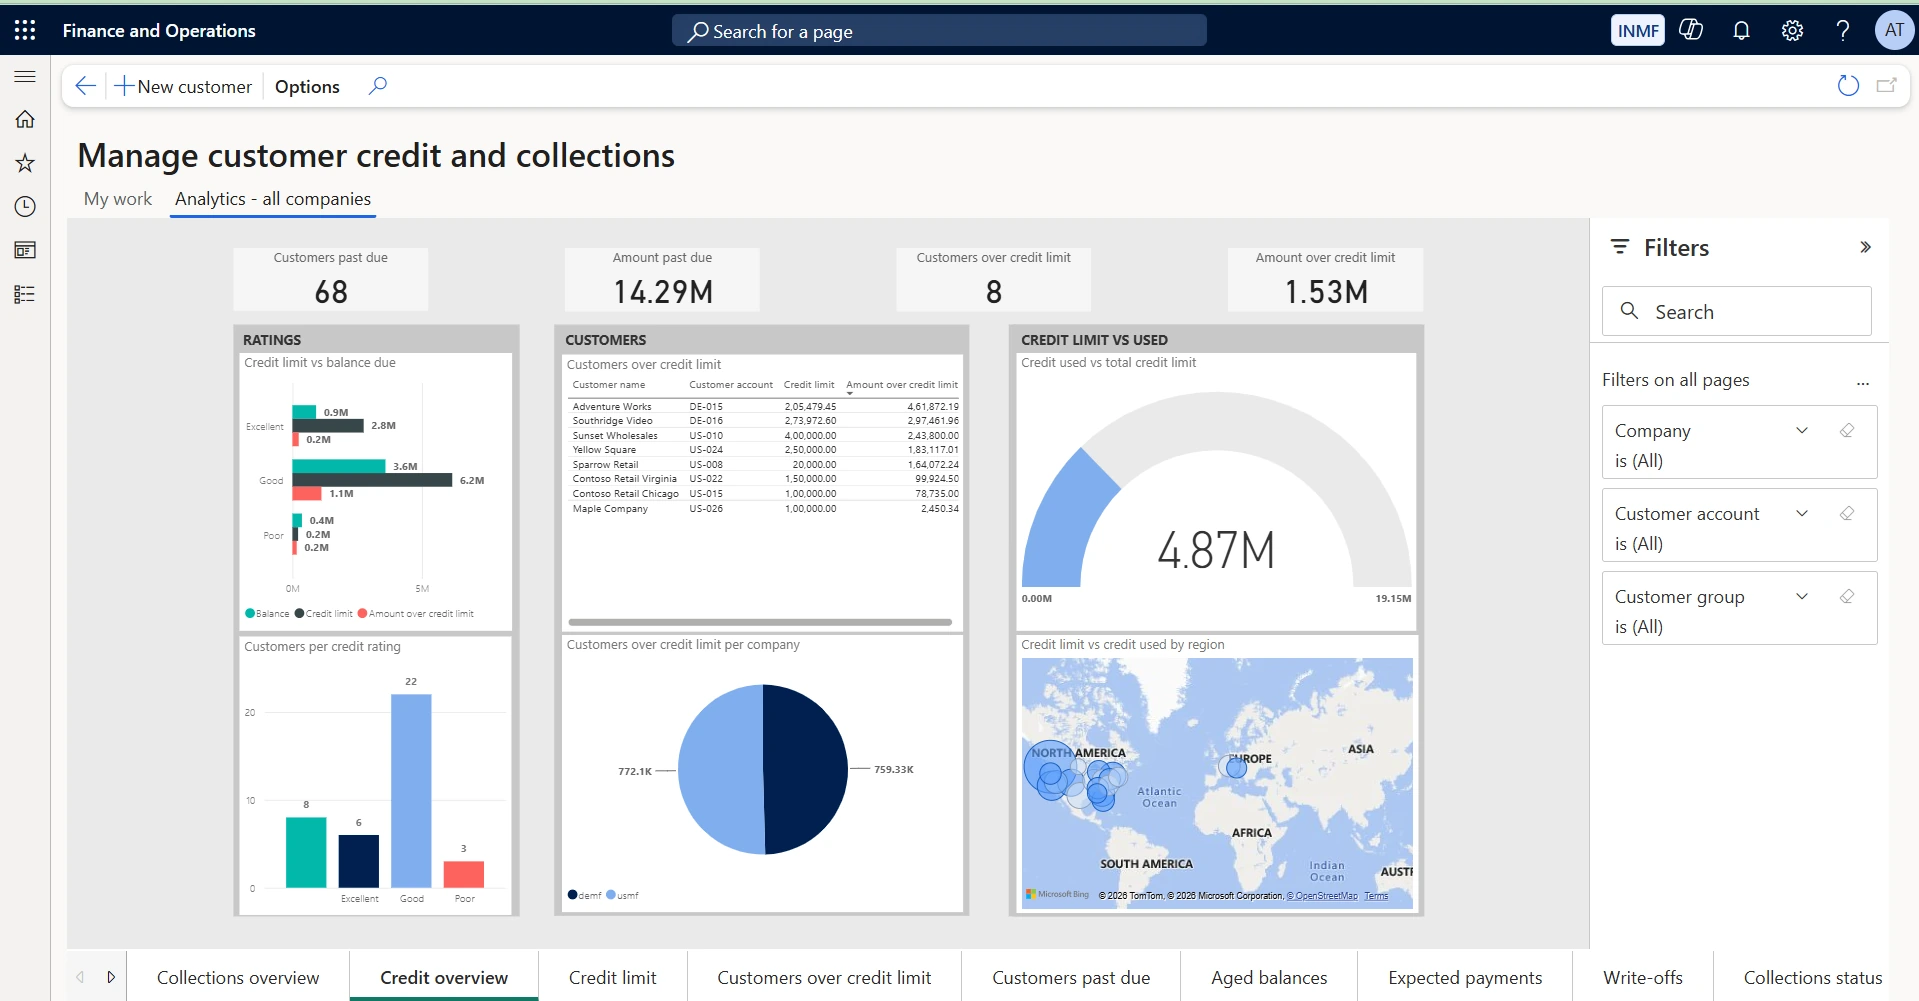
Credit overview
Shows credit limit against balance due by credit rating, customers per credit rating, customers over their credit limit, and credit used against total credit limit. Use it to judge whether credit policy is working — a high proportion of balance sitting against "poor" rated customers signals limits that need review.
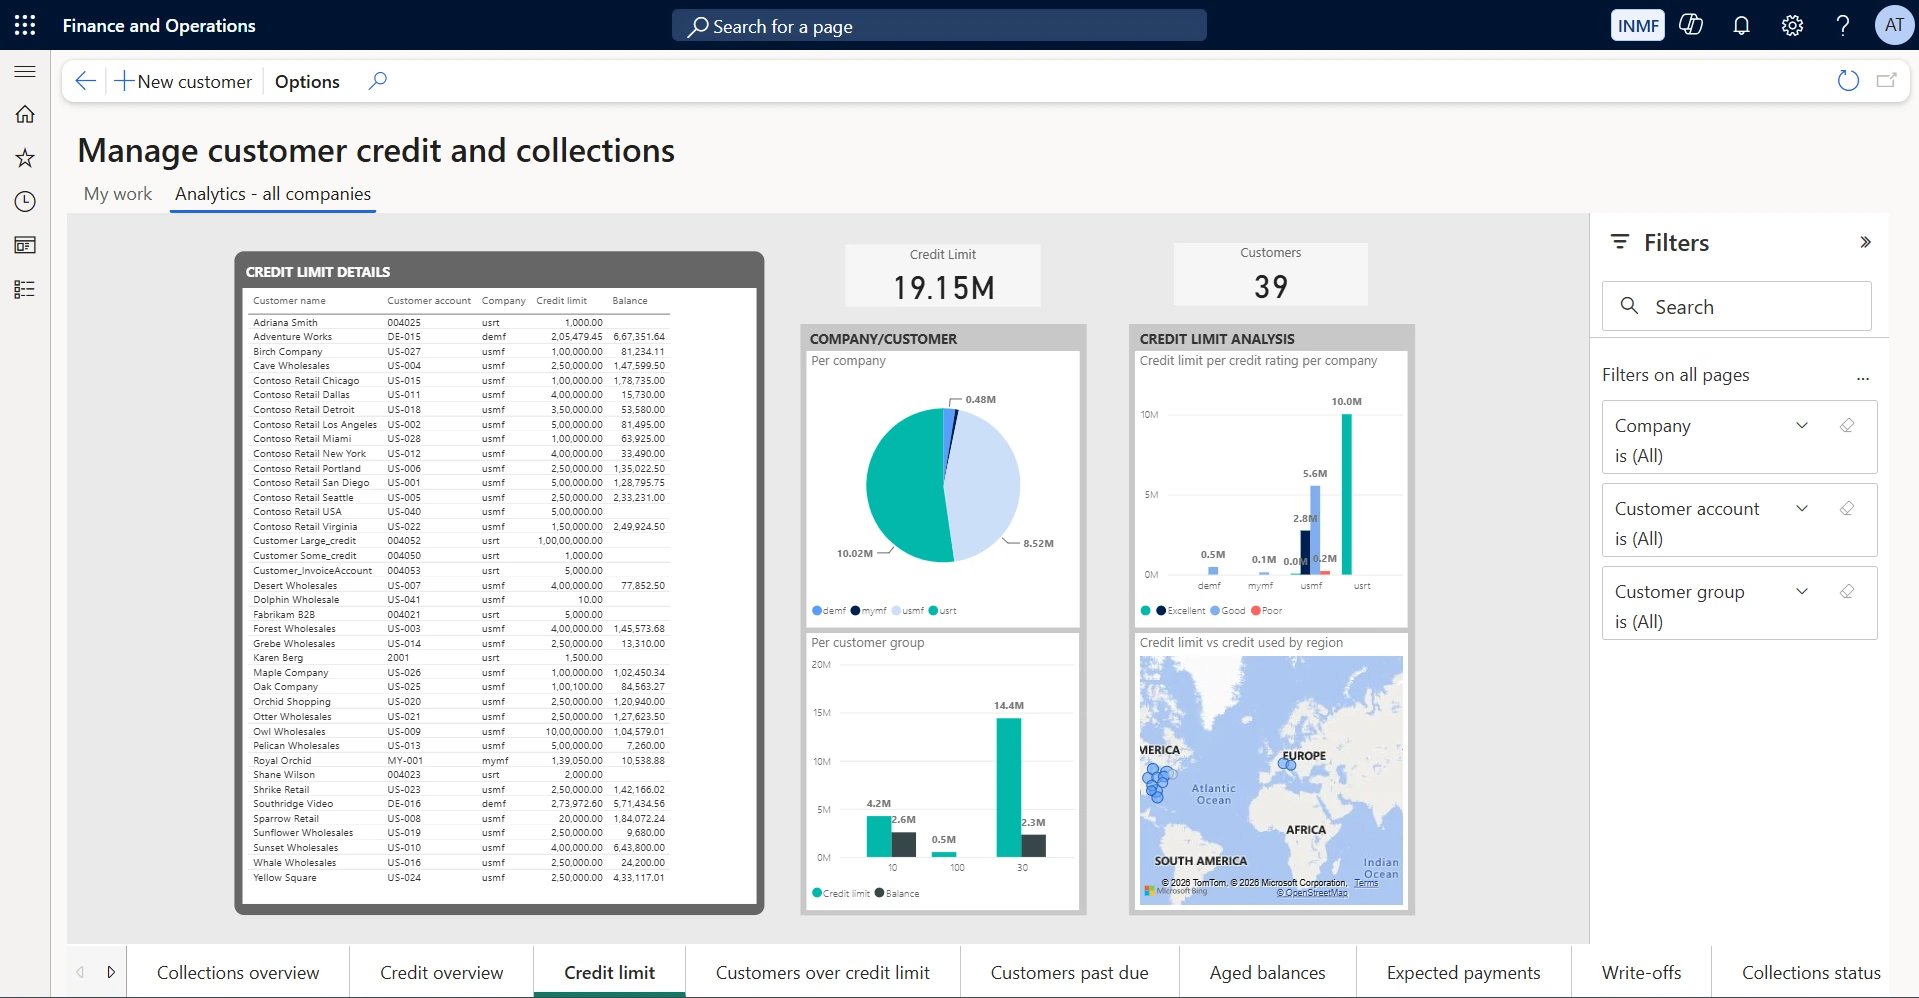
Credit limit
Shows the full credit limit and balance detail for every customer, with credit limit per credit rating per company and credit used by region. Use it during credit review cycles to see which limits are unused, which are fully drawn, and where headroom could be reallocated.
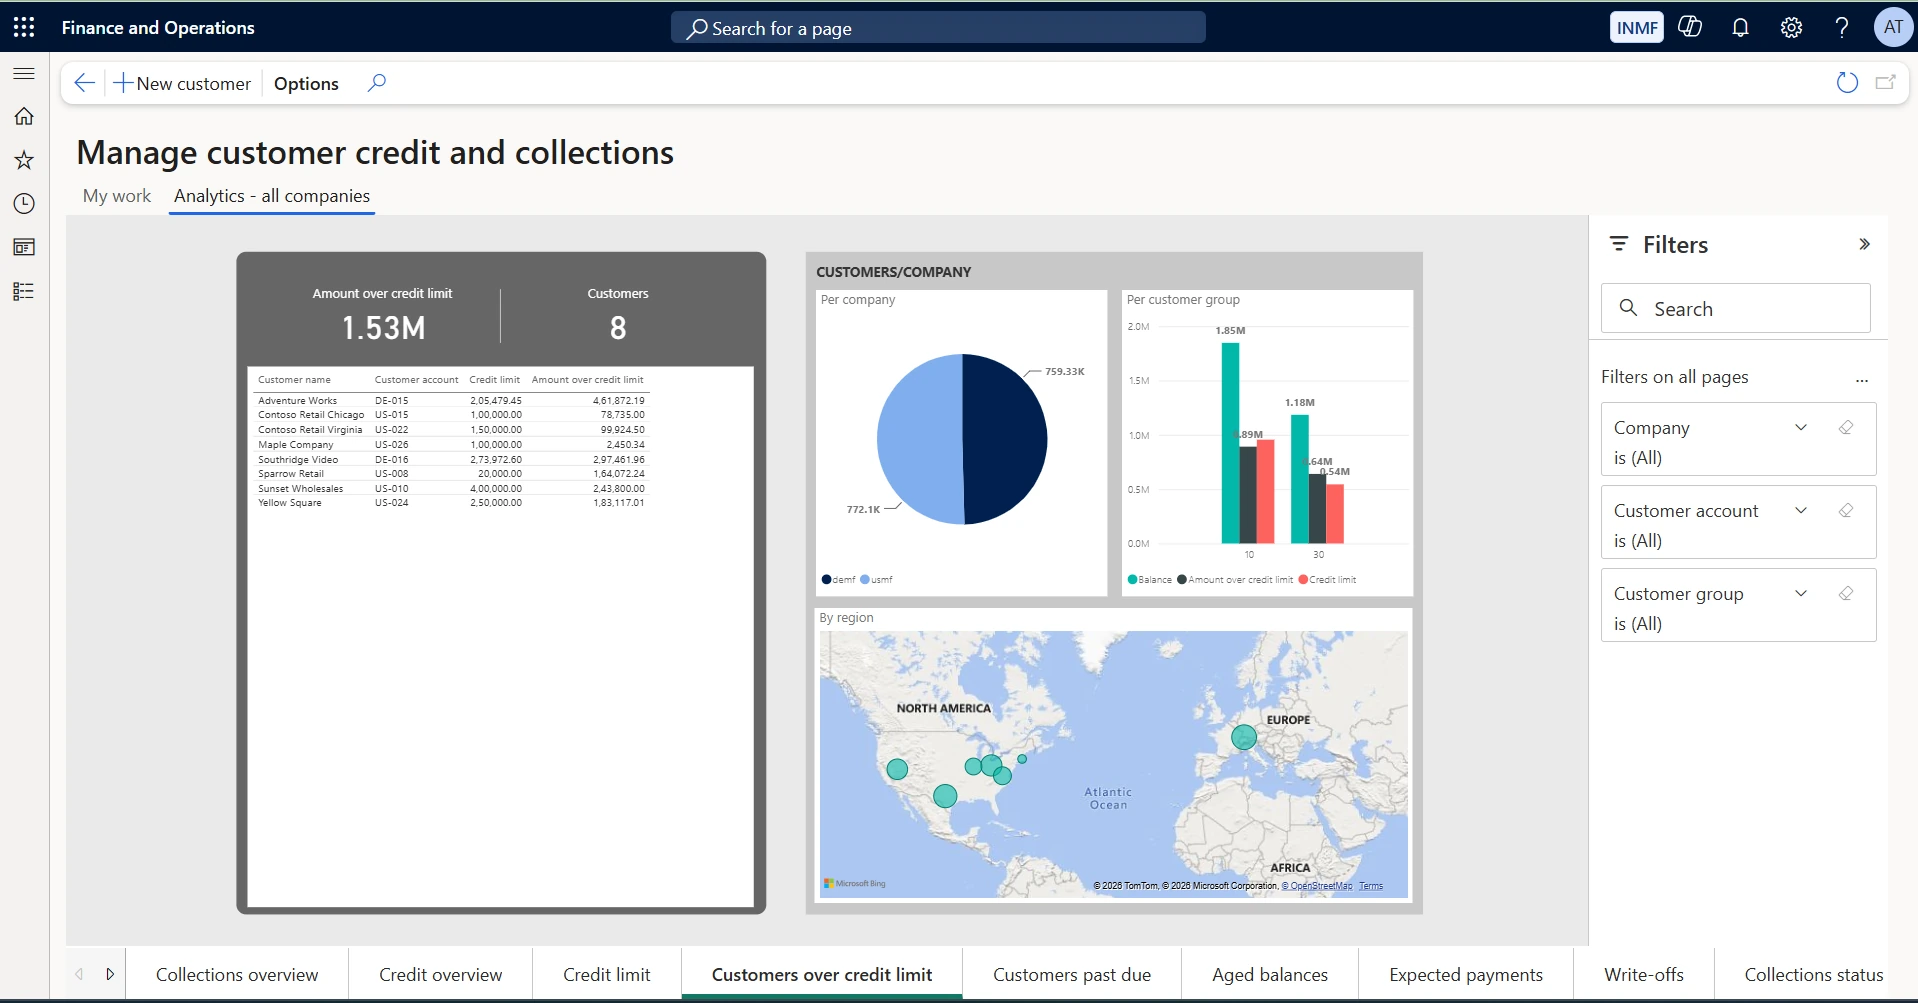
Customers over credit limit
Shows the amount over limit and customer count, with the customer detail and the exposure split per company, per customer group and by region. Use it as an exception list — these are the accounts where further shipment should be authorised deliberately rather than by default.
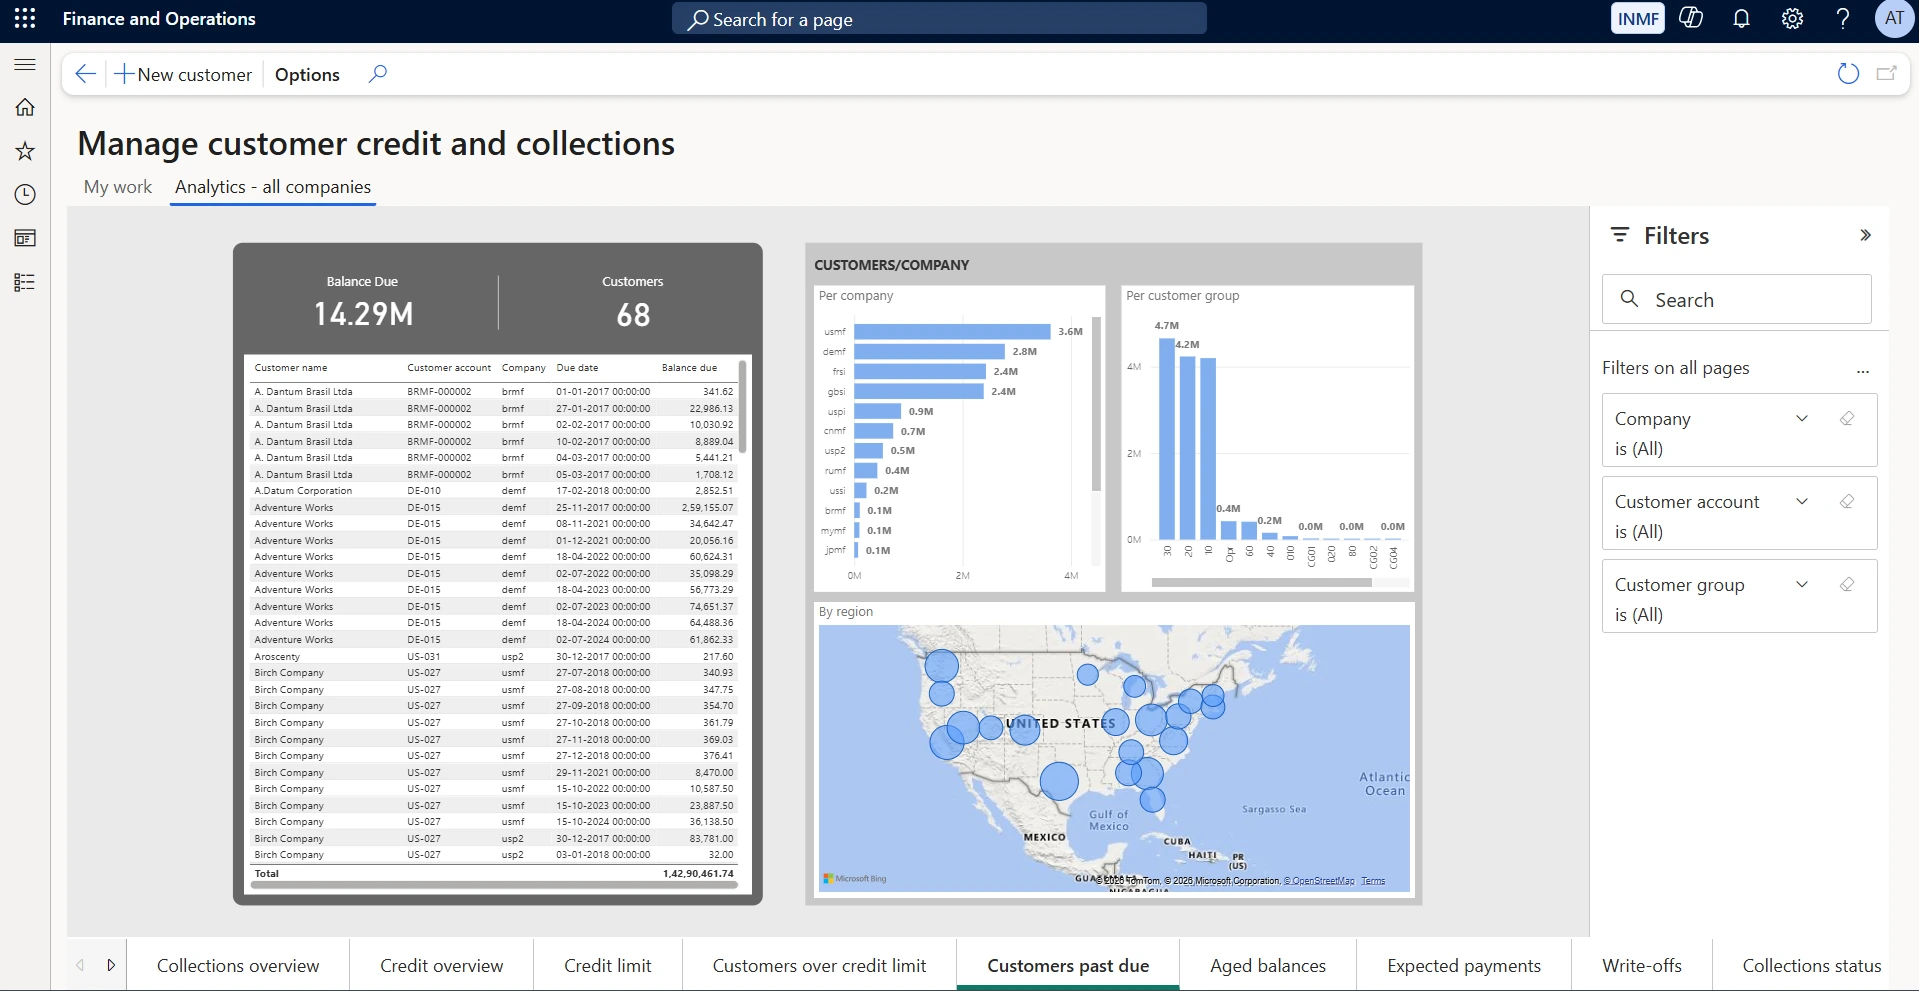
Customers past due
Shows total balance due and customer count, with past due detail per customer and the balance split per company, per customer group and by region. Use it to direct collection effort at the largest and oldest balances rather than working the list alphabetically.
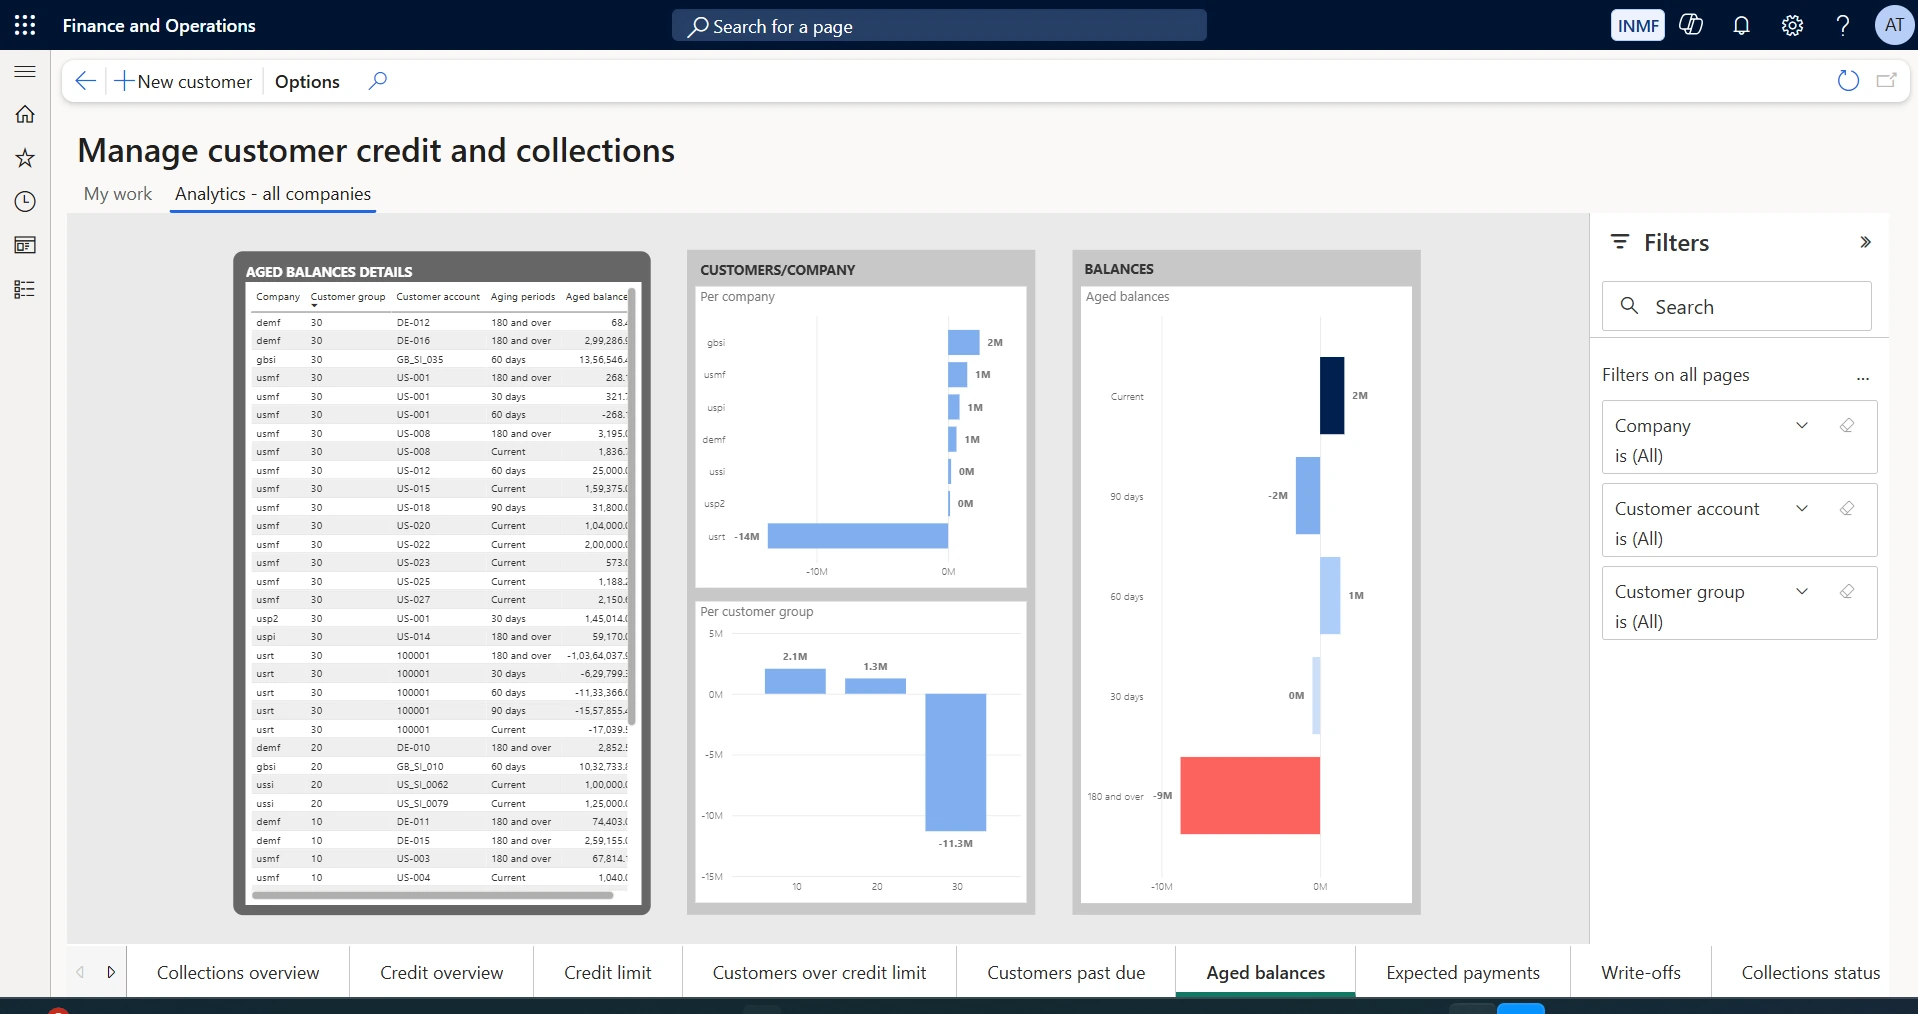
Aged balances
Shows aged balance detail by company, customer group and aging period, with the current, 30, 60, 90 and 180-and-over buckets charted. Use it for bad-debt provisioning and for the aging conversation with auditors — the 180-and-over bucket is usually where provisioning decisions are made.
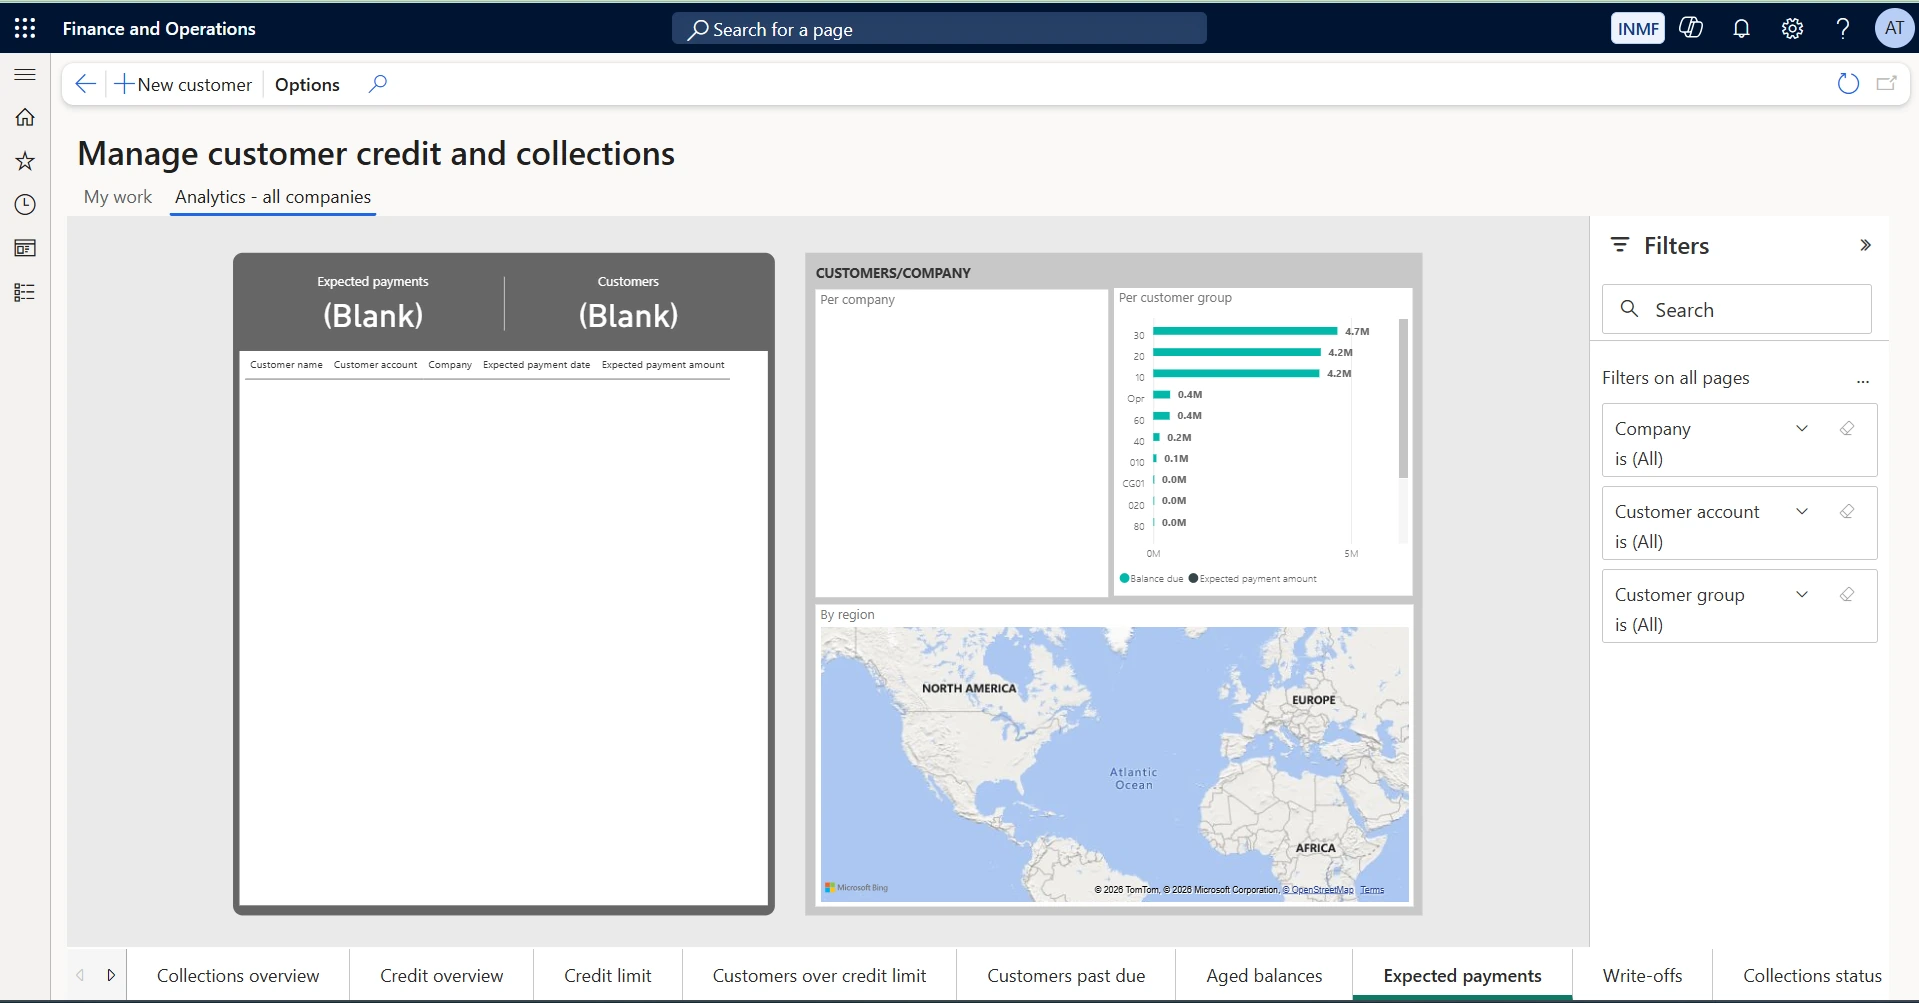
Expected payments
Shows expected payment dates and amounts per customer, compared against balance due per company, customer group and region. Use it to feed short-term cash forecasting with collector-confirmed expectations rather than contractual due dates alone.
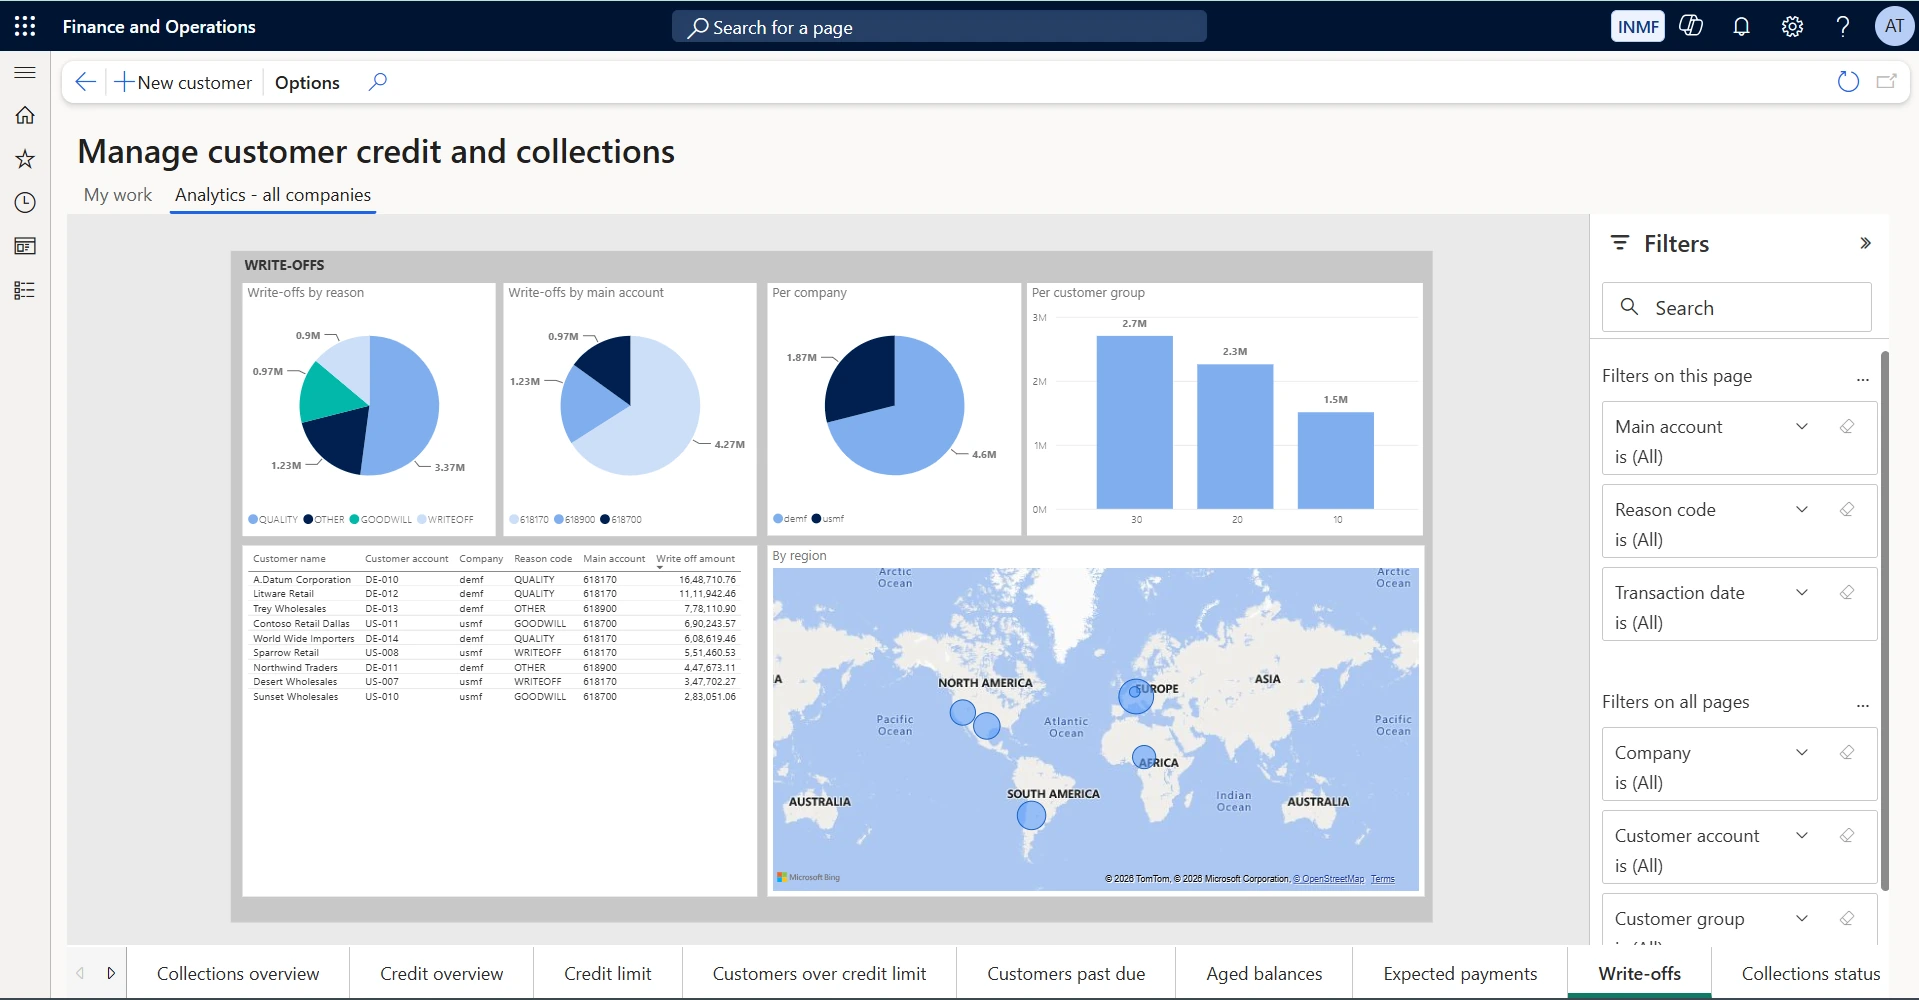
Write-offs
Shows write-offs by reason code and main account, per company and customer group, with the supporting customer detail and a regional view. Use it to review whether write-offs are genuine credit losses or a symptom of upstream problems — a high "quality" reason code points at operations, not collections.
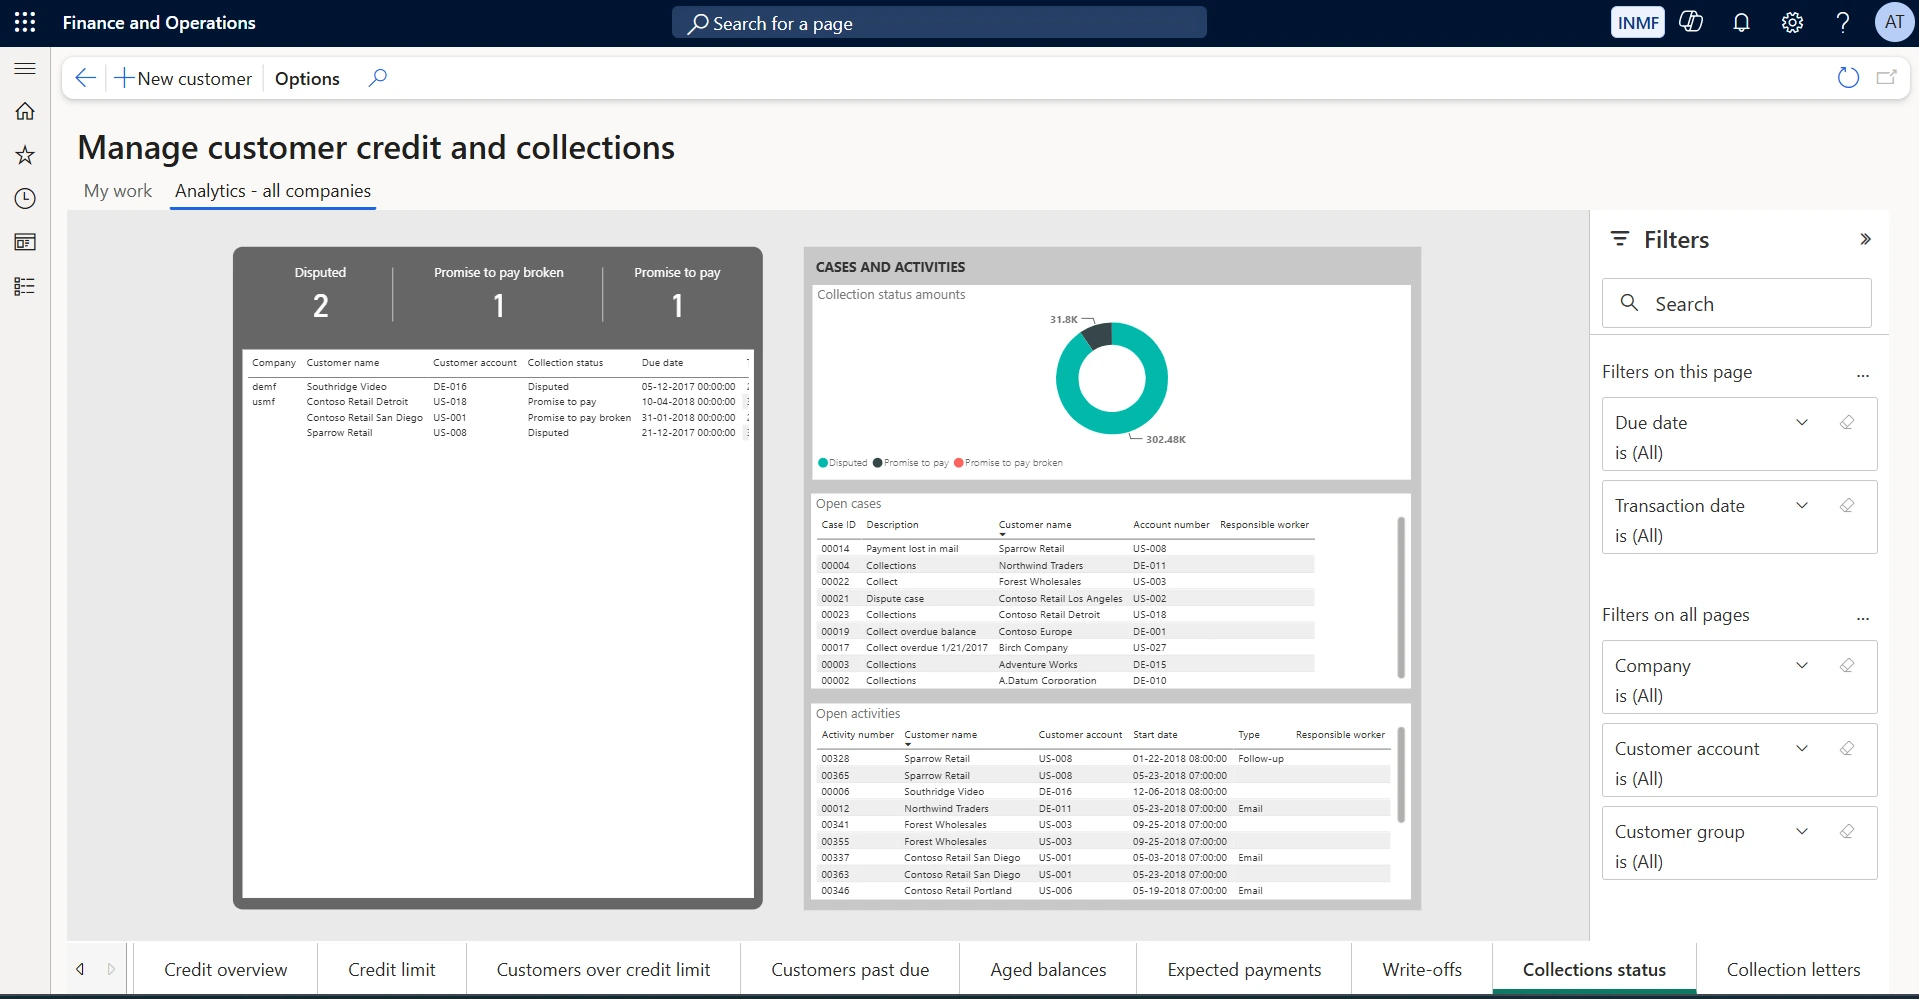
Collections status
Shows disputed, promise-to-pay and promise-to-pay-broken counts, with collection status amounts, open cases and open activities by responsible worker. Use it to manage the collections team — broken promises are the accounts that need escalation, and the activity list shows who is accountable for each.
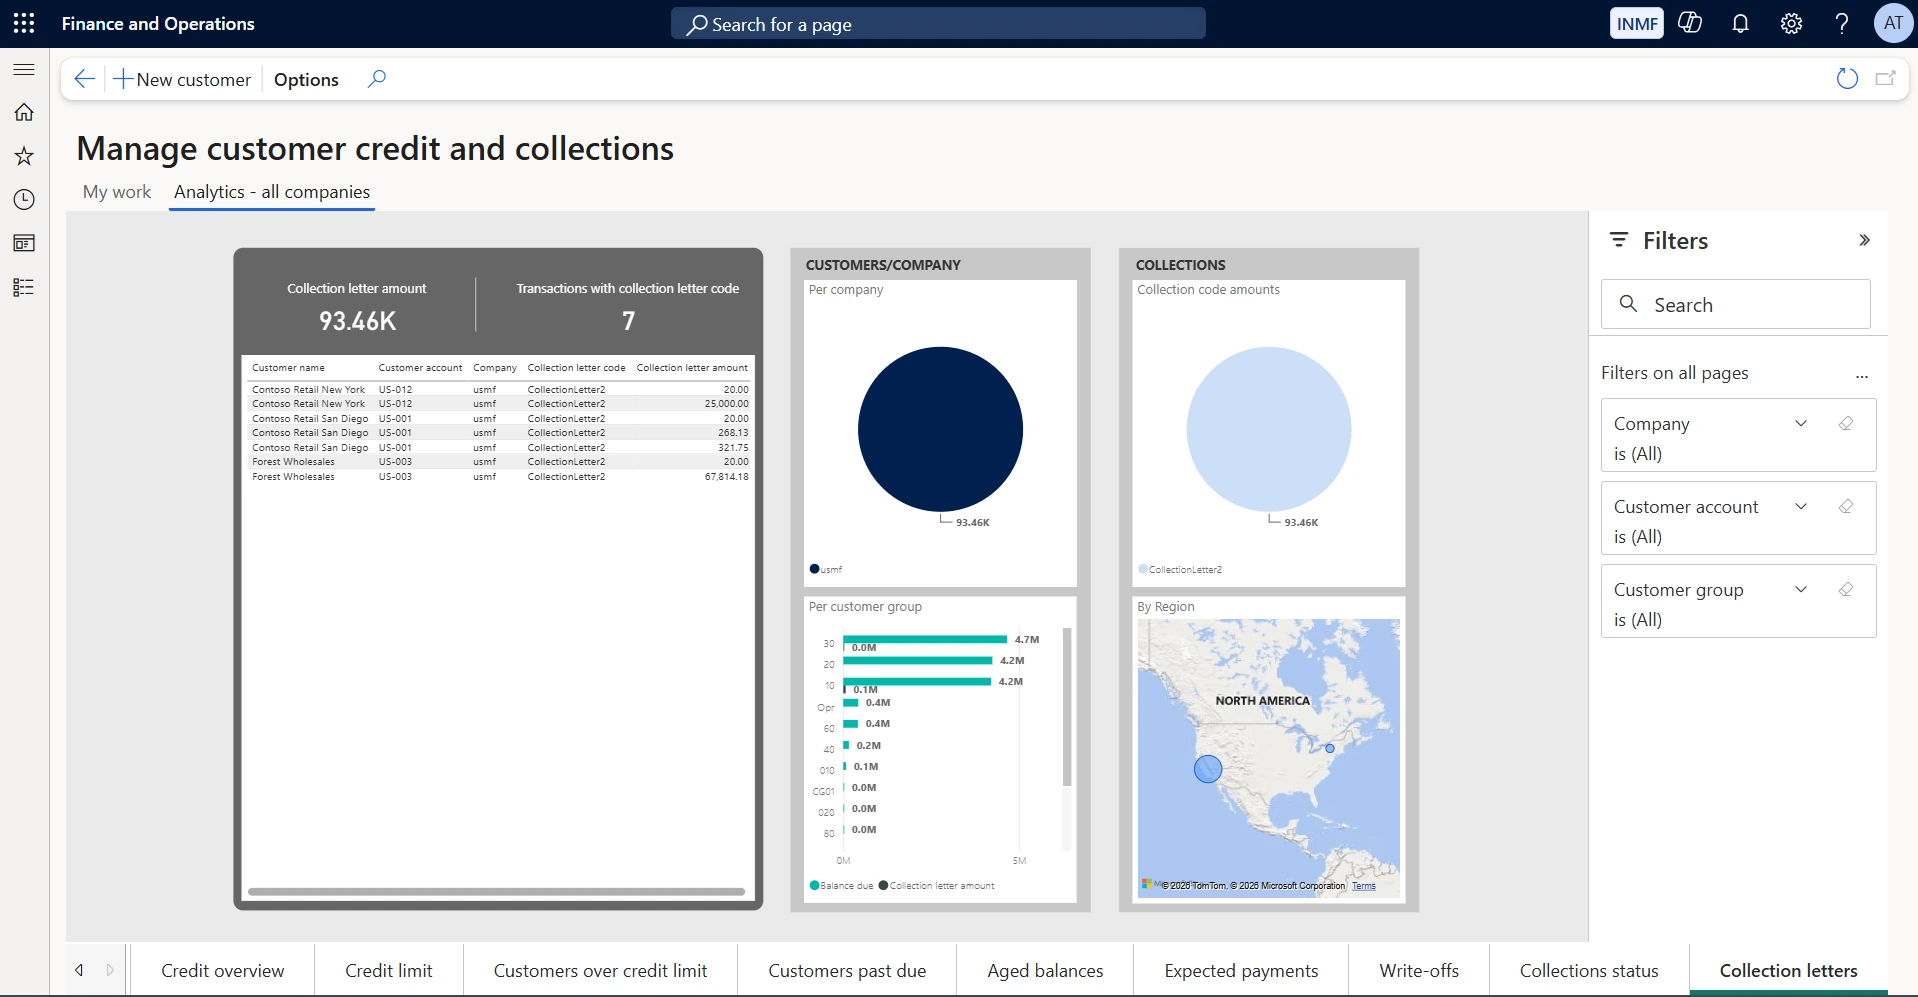
Collection letters
Shows the collection letter amount and the number of transactions carrying a collection letter code, per company, customer group and region. Use it to confirm the dunning cycle is actually running and to see how much balance has reached formal letter stage.
Key metrics & tiles | • Customers past due and amount past due; customers over credit limit and amount over credit limit • Days sales outstanding (DSO), open cases, average days to close a case, open activities, open collection letters, customers and sales on hold • Aged balances by bucket (current, 30, 60, 90, 180 and over), by company, customer group and region • Credit limit against balance due, and credit used against total credit limit, by credit rating • Collection status amounts (disputed, promise to pay, promise to pay broken), write-offs by reason and expected payments |
Typical actions & lists | • Move between the ten report pages using the tab strip at the foot of the workspace • Filter every page by company, customer account and customer group from the Filters pane • Apply page-level filters such as main account, reason code, due date or transaction date • Drill into the supporting customer-level detail listed beside each visual |
Who uses it | • Credit managers and collections managers • Collections clerks (current-company view) |
Why it matters to leadership: DSO and credit exposure are among the metrics a CFO reviews most frequently for cash-flow forecasting — this workspace is where those numbers live, refreshed close to real time rather than at month-end.
Bank management workspace
Module area: Cash and bank management
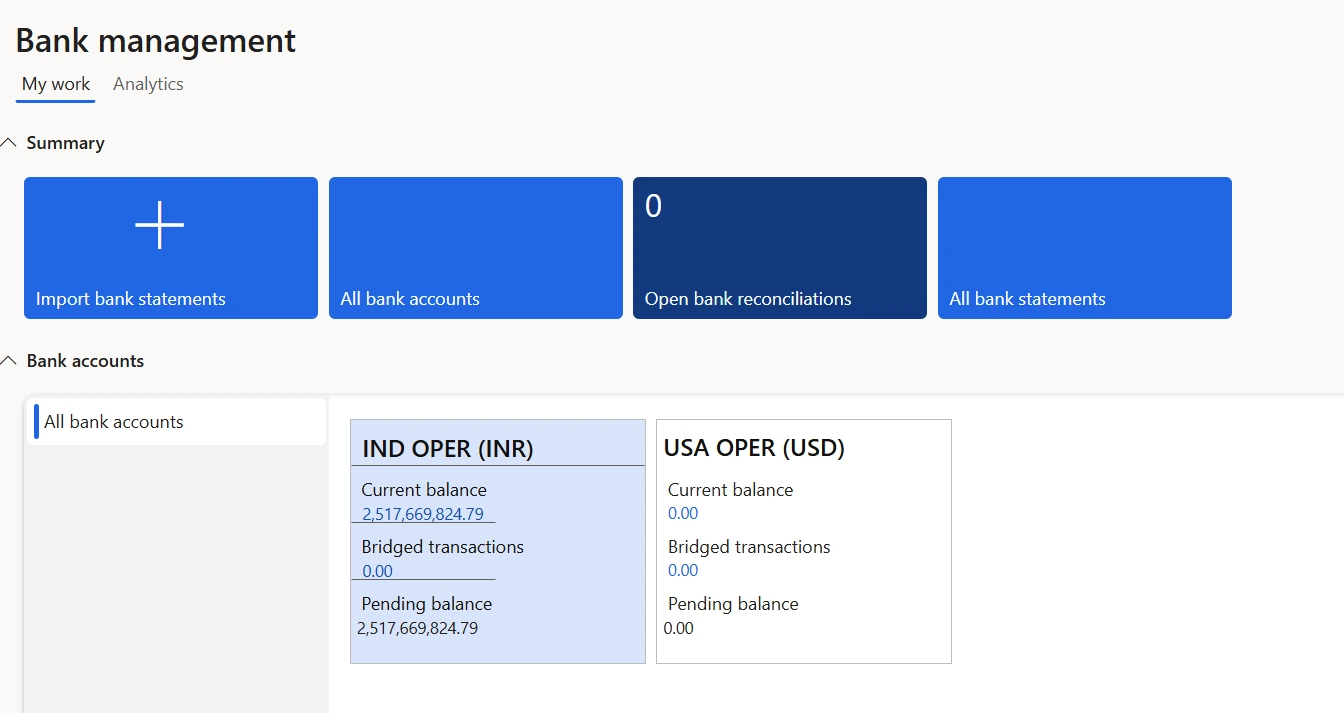
A consolidated, per-bank-account view of cash position, reconciliation status and historical balances. The My work tab carries the operational tiles and a card for every bank account; the companion Cash overview analytics rolls balances up across companies and currencies.
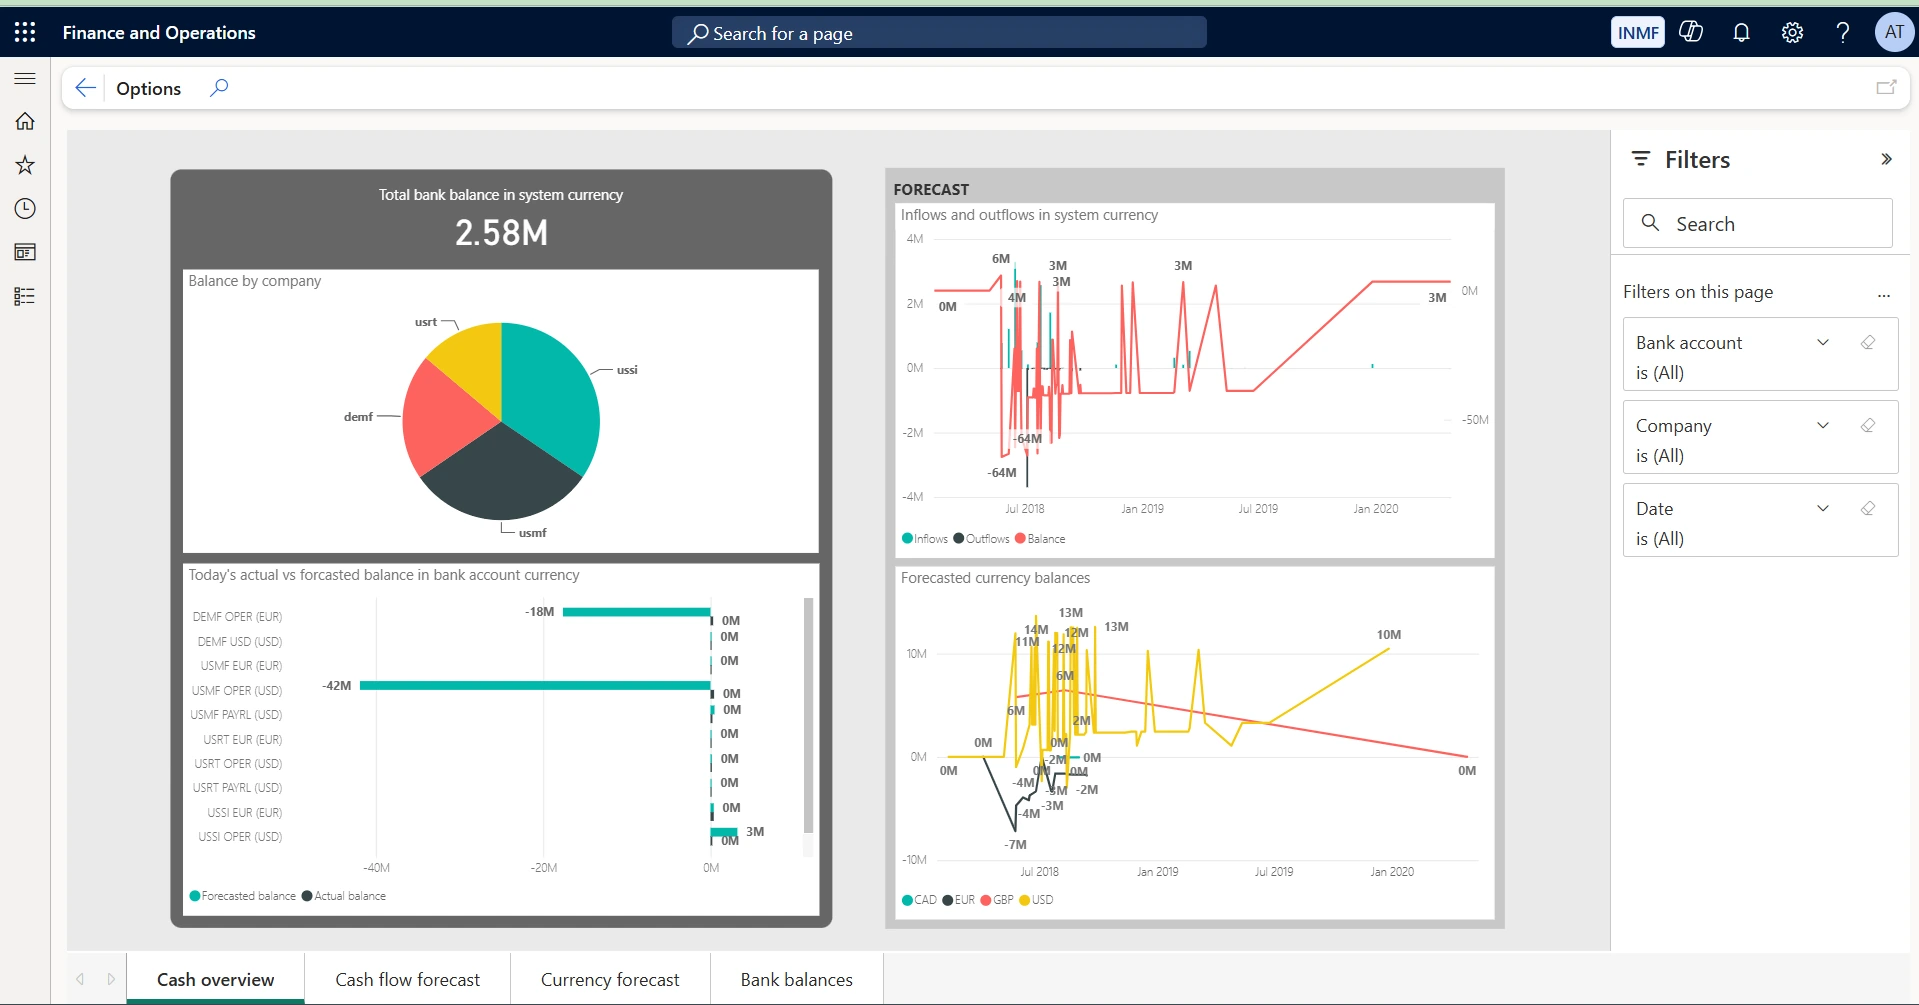
The analytics are organised as four report pages — Cash overview, Cash flow forecast, Currency forecast and Bank balances — each filterable by bank account, company, currency and date.
Bank management — My work
Shows the operational tiles — import bank statements, all bank accounts, open bank reconciliations and all bank statements — above a card for each bank account giving current balance, bridged (in-transit) transactions and pending balance. Use it as the treasury daily start page: the open reconciliations tile flags unreconciled accounts, and each card drills into the transactions behind the balance.
Cash overview
Shows total bank balance in system currency, balance by company, today’s actual against forecasted balance per account, and inflows, outflows and forecasted currency balances. Use it for the consolidated liquidity position across all entities, and to see immediately where actual cash has diverged from what was forecast.
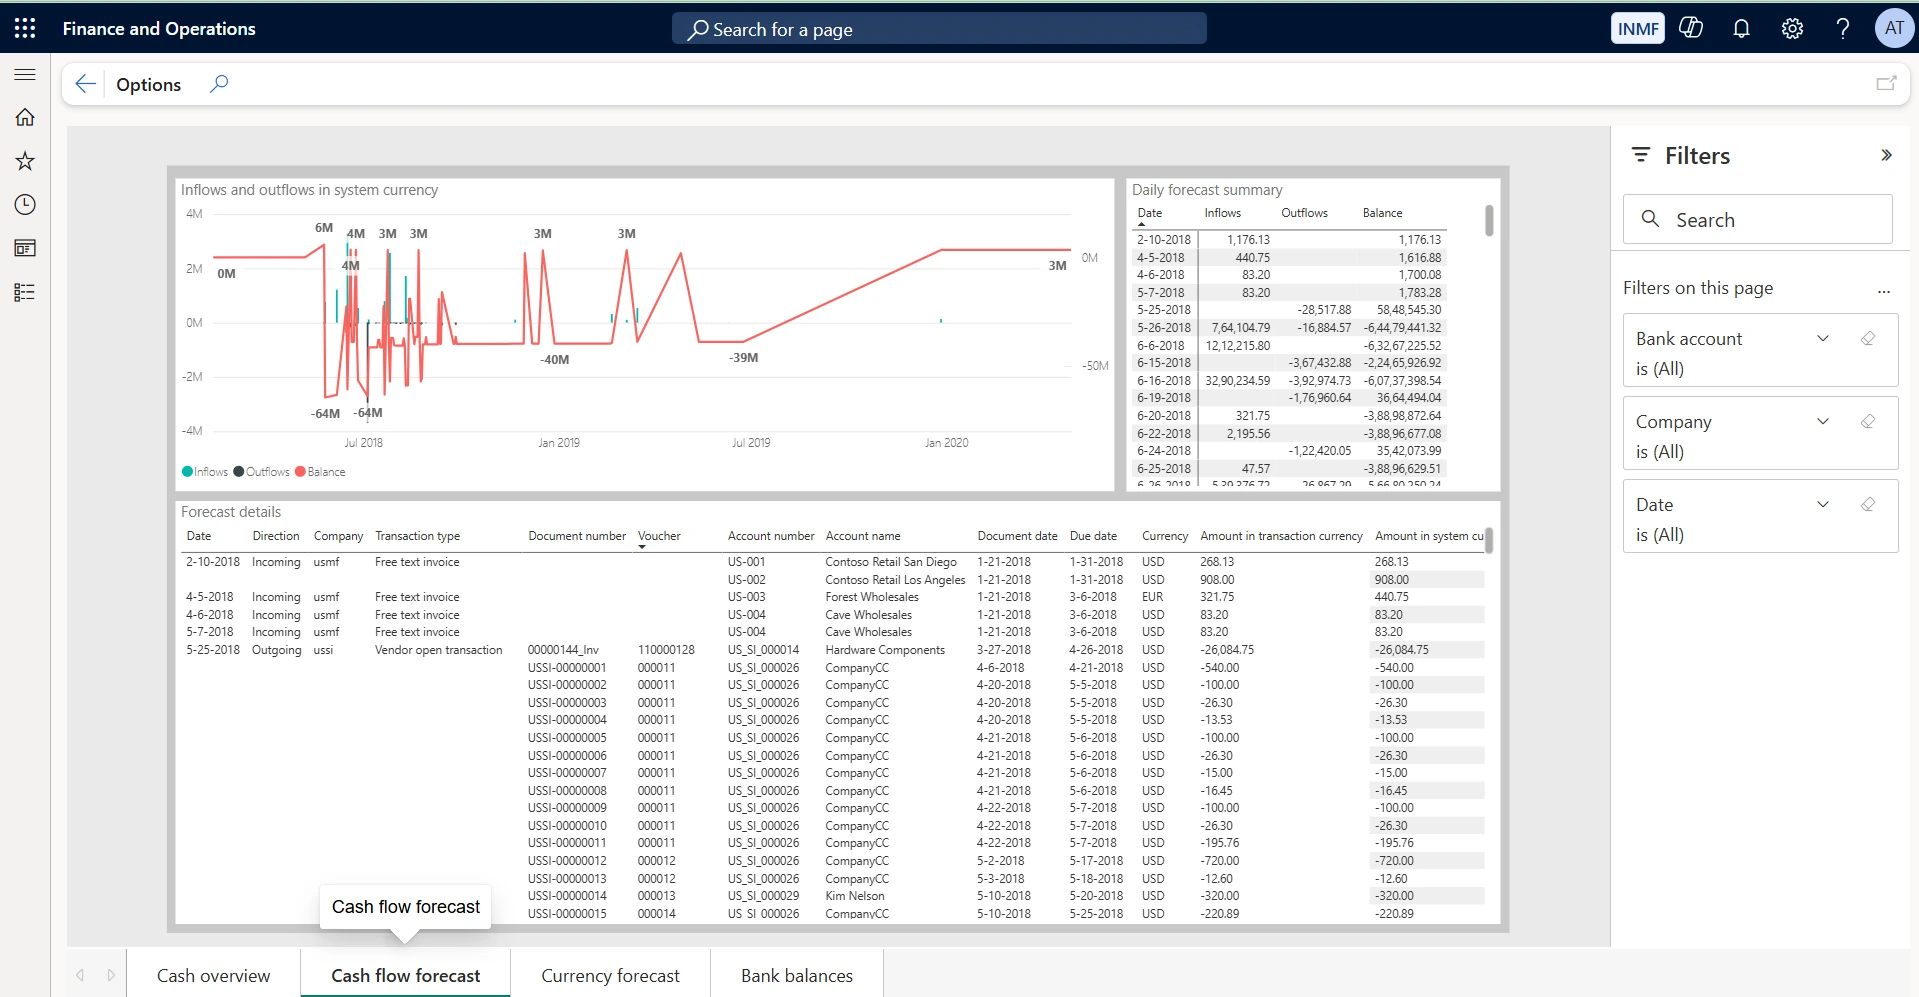
Cash flow forecast
Shows inflows and outflows in system currency with a daily forecast summary and the forecast detail behind each movement. Use it for short-term cash planning — the detail grid identifies the specific purchase orders, invoices and open transactions creating each forecast movement.
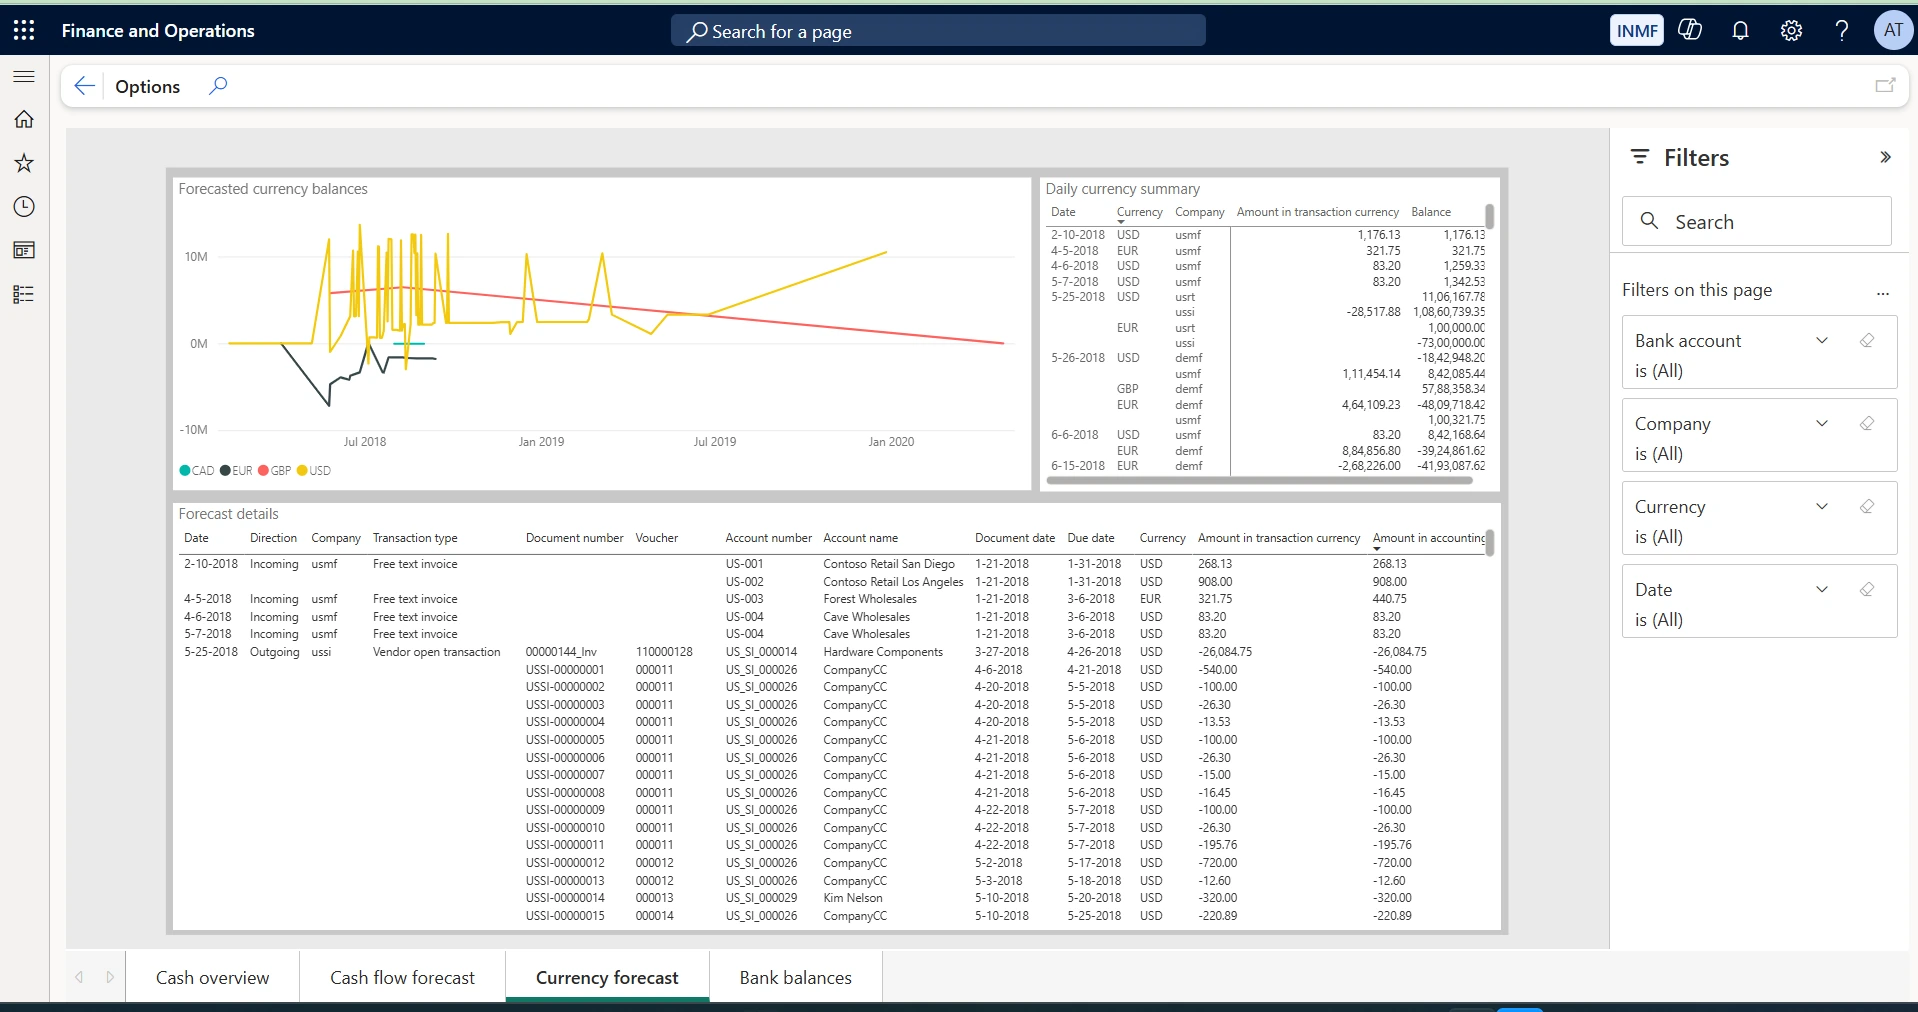
Currency forecast
Shows forecasted balances by currency with a daily currency summary and the underlying forecast detail. Use it to manage currency exposure — it shows when a currency position is expected to turn negative and therefore when cover or a transfer is needed.
Bank balances
Shows total bank balance and balance by company, today’s actual against forecasted balance per account, and balances by bank account and by currency. Use it to review where cash is physically held and whether it is concentrated in the right accounts and currencies.
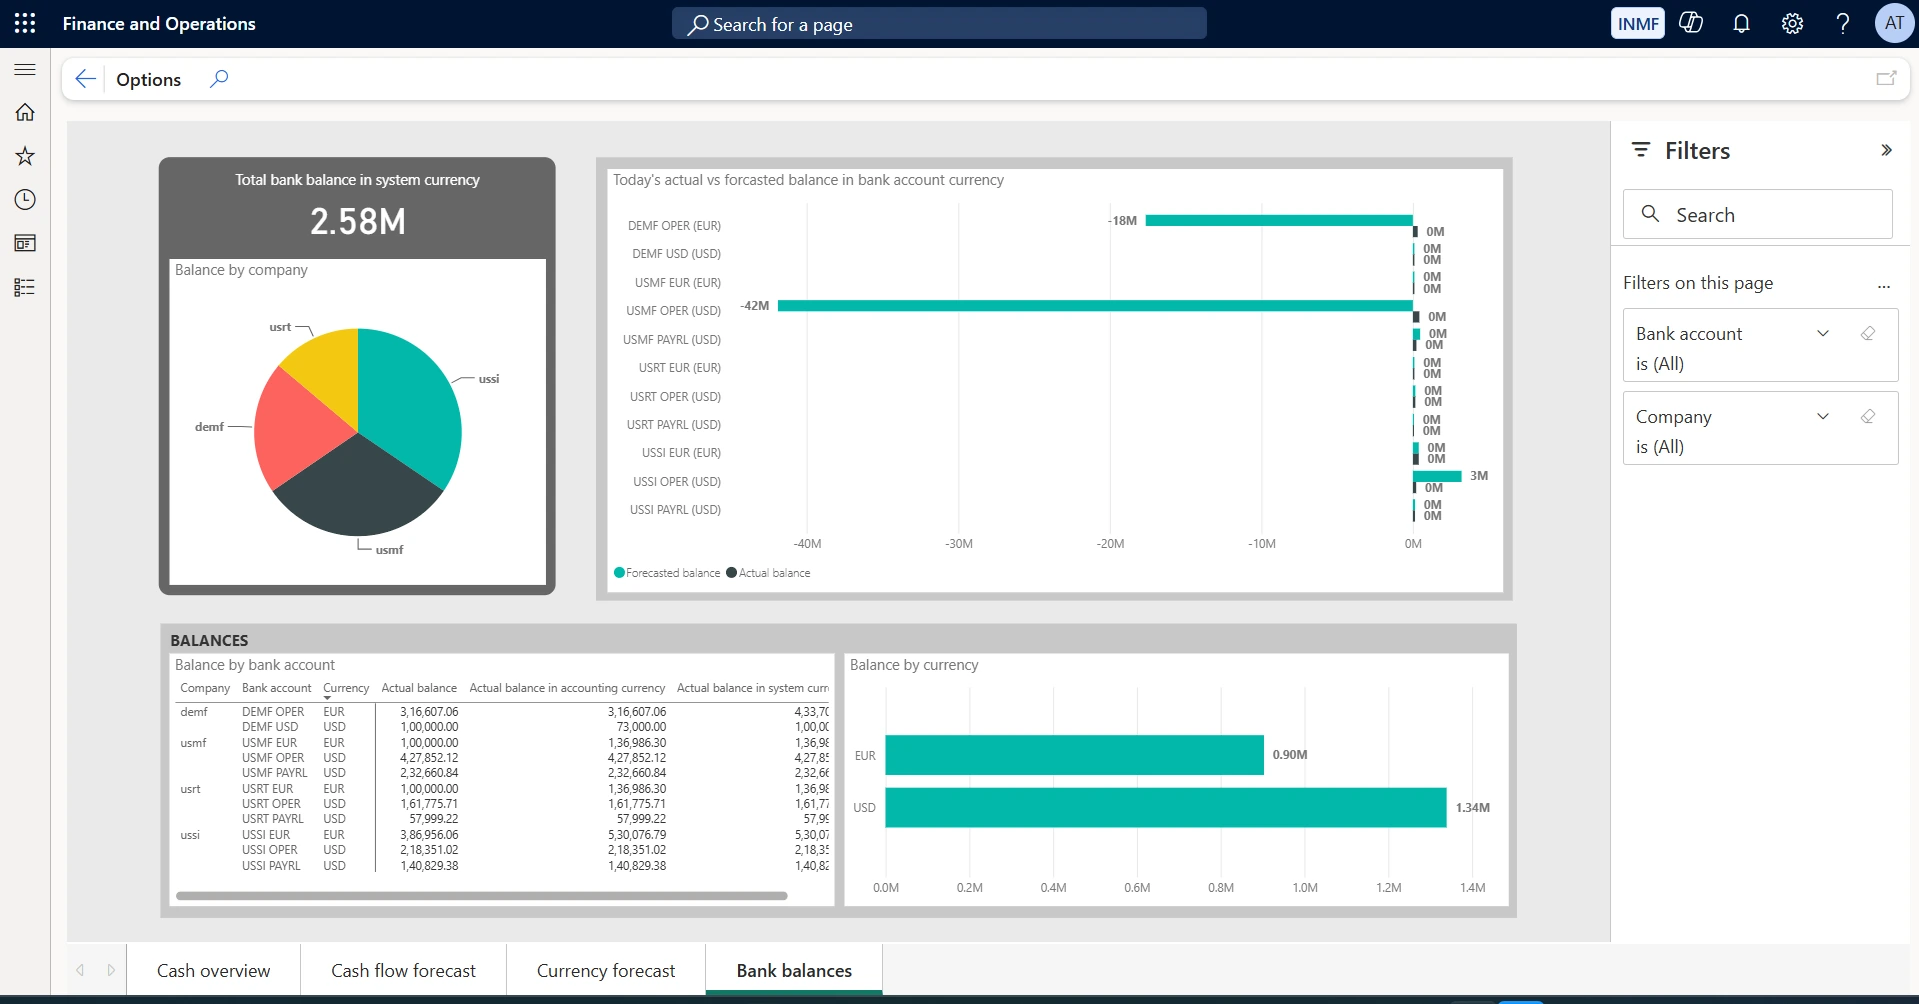
Key metrics & tiles | • Open bank reconciliations, with shortcuts to import bank statements and to all bank accounts and statements • A card per bank account showing current balance, bridged (in-transit) transactions and pending balance • Total bank balance in system currency, and balance by company, bank account and currency • Today’s actual balance against forecasted balance, per bank account and currency • Inflows, outflows and running balance, with a daily forecast summary and forecast detail |
Typical actions & lists | • Import bank statements and open bank reconciliations from the summary tiles • Drill from a bank account card into its underlying transactions • Create bank transfers and review bridged (in-transit) transactions • Filter the analytics pages by bank account, company, currency and date |
Who uses it | • Treasury and cash managers • Accounting staff responsible for bank reconciliation |
Why it matters to leadership: Gives leadership a real-time, consolidated liquidity position across every account and entity, plus a forecast-versus-actual check — core inputs to treasury and short-term cash decisions.
Fixed asset management workspace
Module area: Fixed assets
Tracks the fixed-asset lifecycle — acquisition, depreciation and disposal — with a search-driven view into any asset’s books and valuations, plus a cross-company analytics tab for net book value. The Analytics – all companies tab carries two report pages: Fixed asset valuations and Valuations map.
Fixed asset valuations
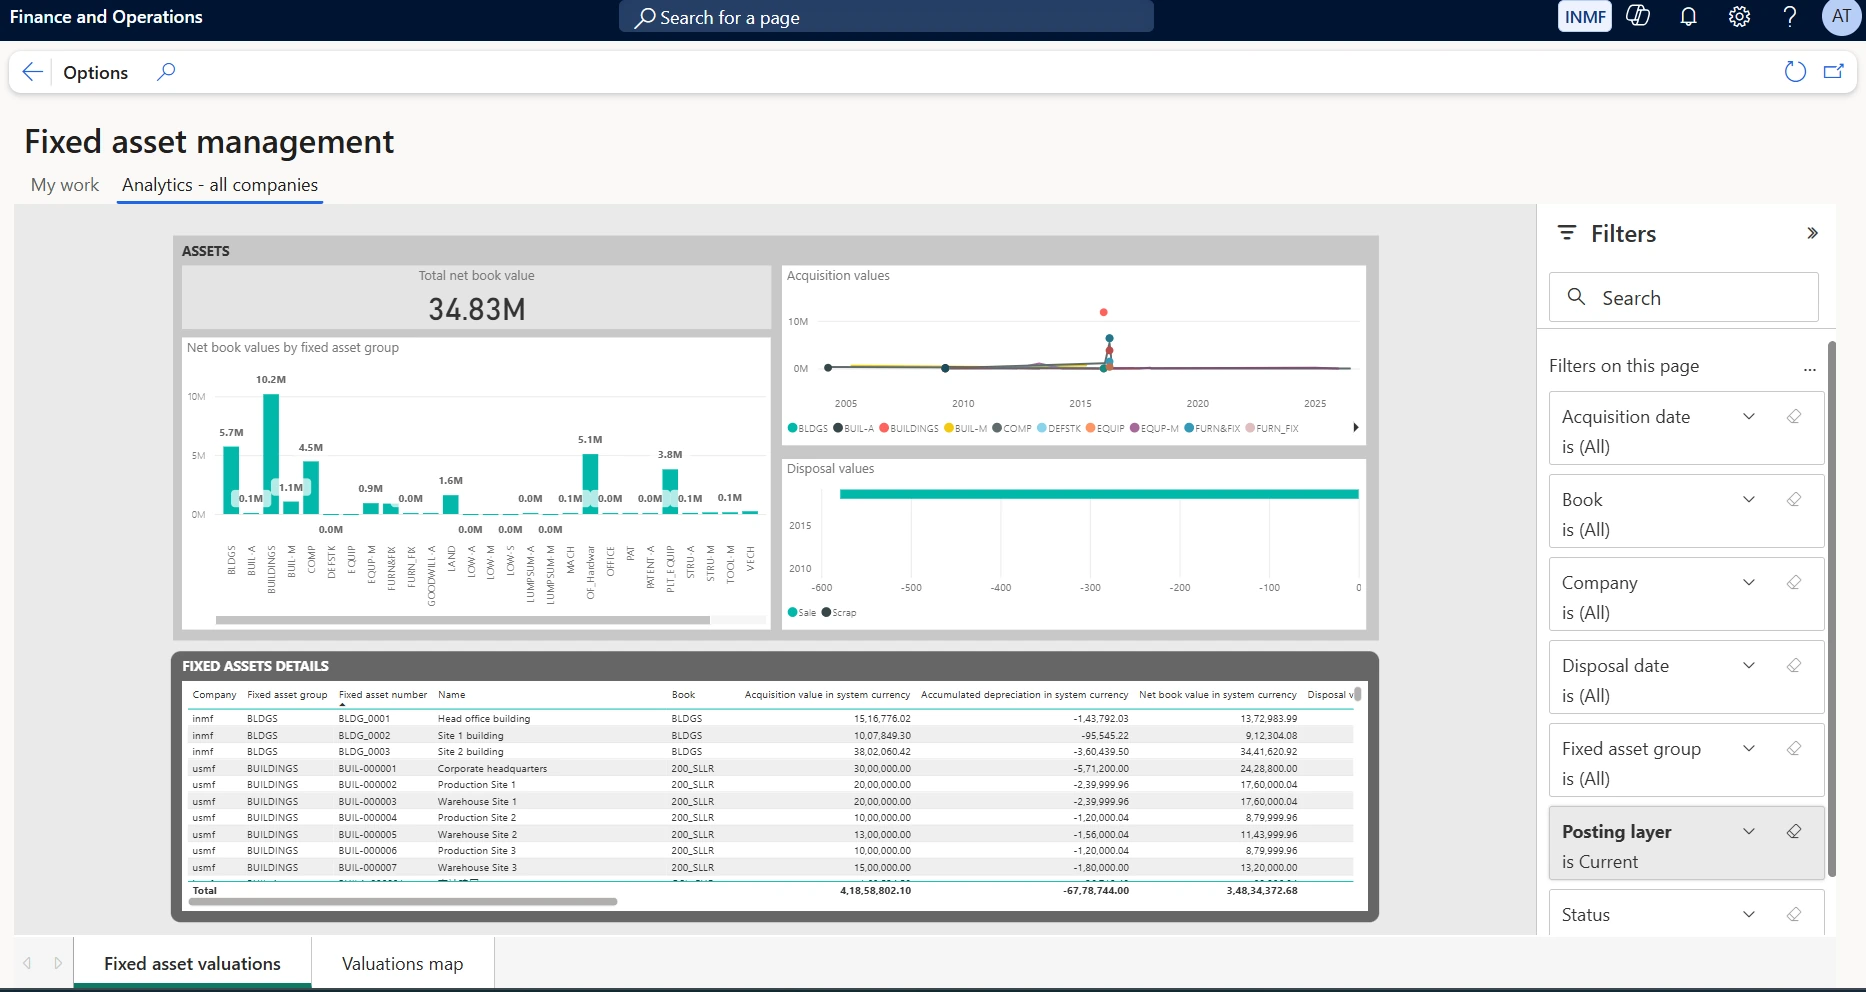
Shows total net book value, net book values by fixed asset group, acquisition values over time and disposal values split by sale and scrap, above the fixed asset detail list. Use it for capital planning and audit preparation — the detail grid reconciles acquisition value, accumulated depreciation and net book value per asset and book.
Valuations map
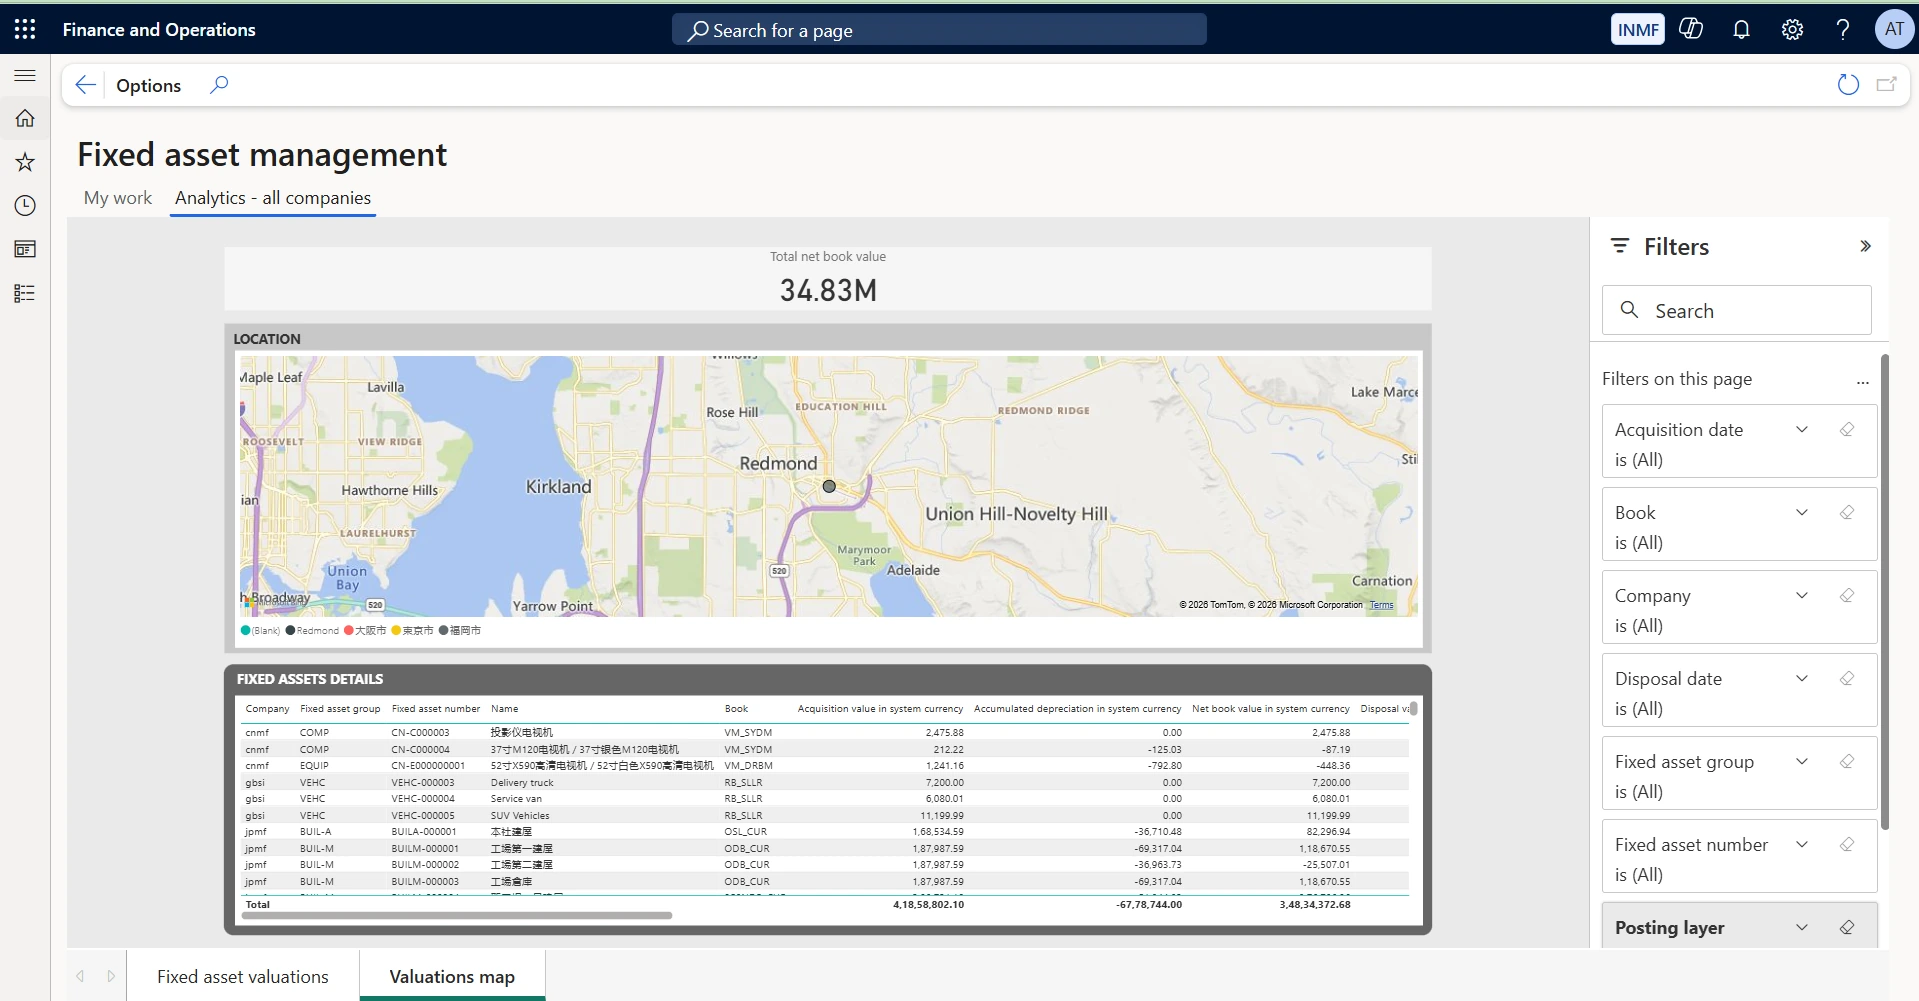
Shows asset locations plotted geographically against total net book value, with the same fixed asset detail beneath. Use it to see where capital is physically deployed, which supports insurance valuation, site-level investment decisions and physical verification planning.
Key metrics & tiles | • Total net book value across all companies • Net book values by fixed asset group • Acquisition values over time, and disposal values split by sale and scrap • Asset locations plotted on a map • Acquisition value, accumulated depreciation and net book value per asset and per book |
Typical actions & lists | • Filter by acquisition date, disposal date, book, company, fixed asset group, fixed asset number, posting layer and status • Search assets by number, group, name, location or responsible person • Review depreciation schedules ("Profile") and current valuations ("Balances") per book • Run the batch depreciation proposal and post fixed-asset journals |
Who uses it | • Fixed asset accountants • Controllers (cross-company analytics view) |
Why it matters to leadership: Consolidates net book value and capital-asset activity across every entity into one view, supporting capital planning, depreciation forecasting and audit readiness.
Cost control workspace
Module area: Cost accounting
Built for managers of cost objects — cost centres, product groups or other dimension combinations — this workspace compares actual cost to budget and automatically flags variances that exceed a defined threshold.
Cost control statement
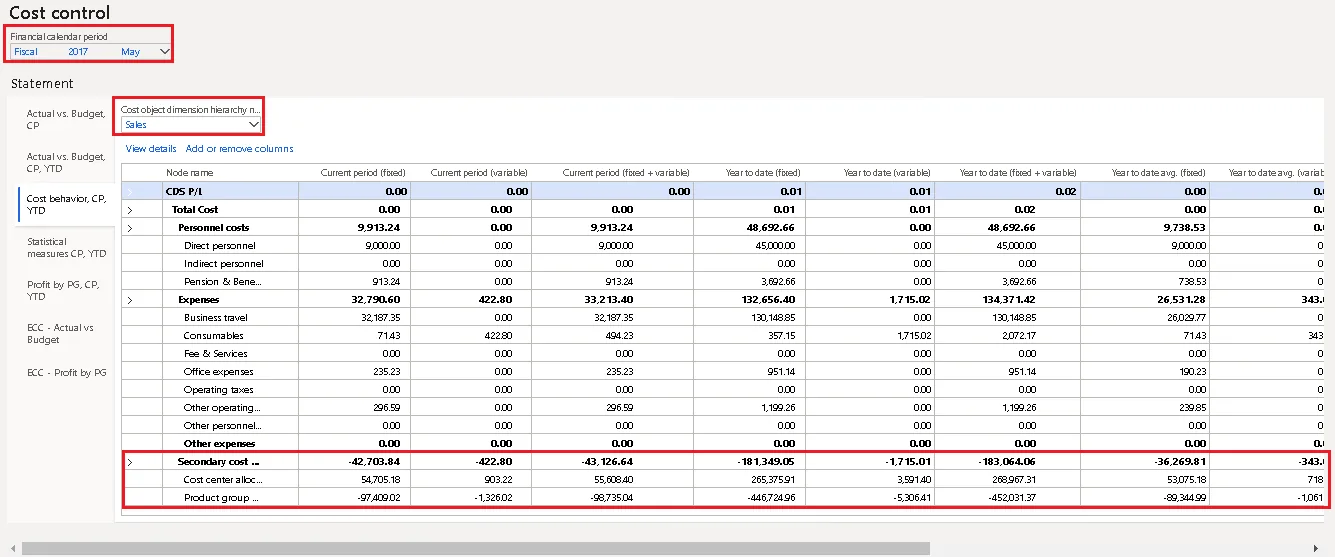
Shows actual cost by fixed, variable and combined columns for the current period and year to date, with selectable statement views for actual versus budget and cost behaviour. Use it to give a cost-centre owner their own numbers — the fixed/variable split shows which costs are genuinely controllable within the period.
Cost element details
Shows the drill-down from a cost control statement line into individual cost element entries, with actual, budget and revised budget balance by period. Use it to answer "why is my centre over budget" — it isolates the specific cost elements and periods driving the variance.
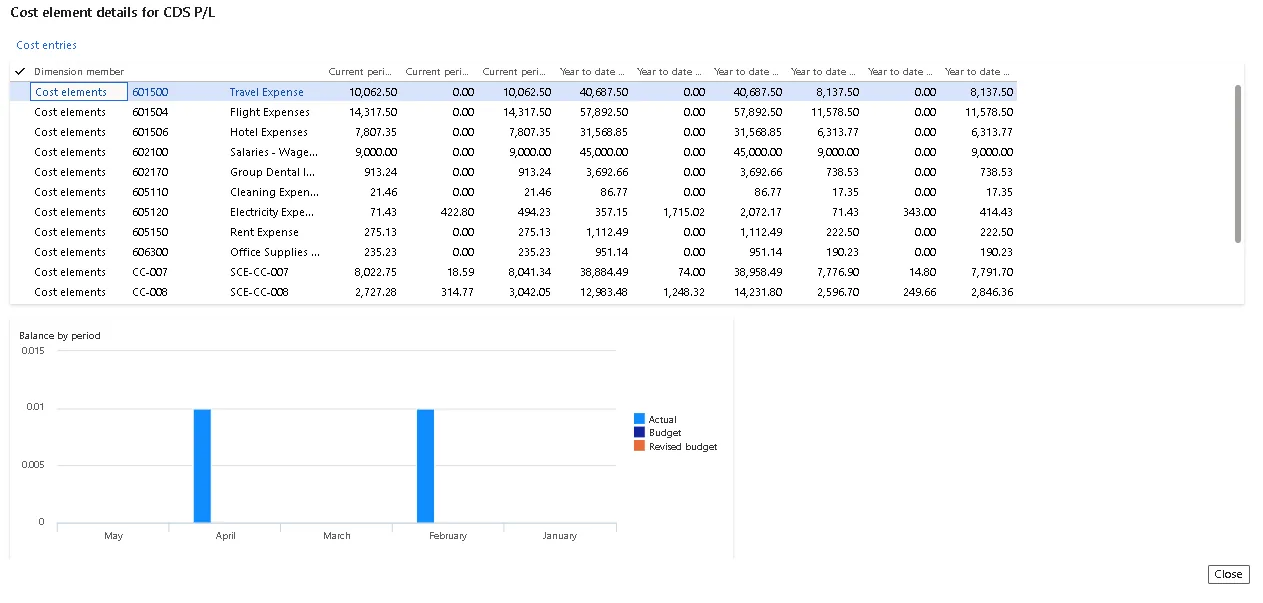
Key metrics & tiles | • Actual cost by fixed, variable, unclassified and total cost columns • Budget balance, and variance in both dollar and percentage terms • Variance trend over the fiscal periods selected |
Typical actions & lists | • Customize which columns, fiscal periods and dimension hierarchies appear • Drill into individual cost entries or allocation-base detail behind any number • Review variances highlighted automatically when they exceed a set threshold |
Who uses it | • Cost accounting managers and cost accountants • Cost object controllers (published, read-focused reports) |
Why it matters to leadership: Pushes budget-variance accountability down to the people who actually own the spend, with exceptions surfaced automatically — which shortens the time between an overrun occurring and someone acting on it.
Budget planning workspace
Module area: Budgeting
The working hub for the annual or periodic budgeting cycle: building draft budget plans (in the client or the Excel add-in), routing them for review, and publishing the final numbers into budget register entries that feed budget control.
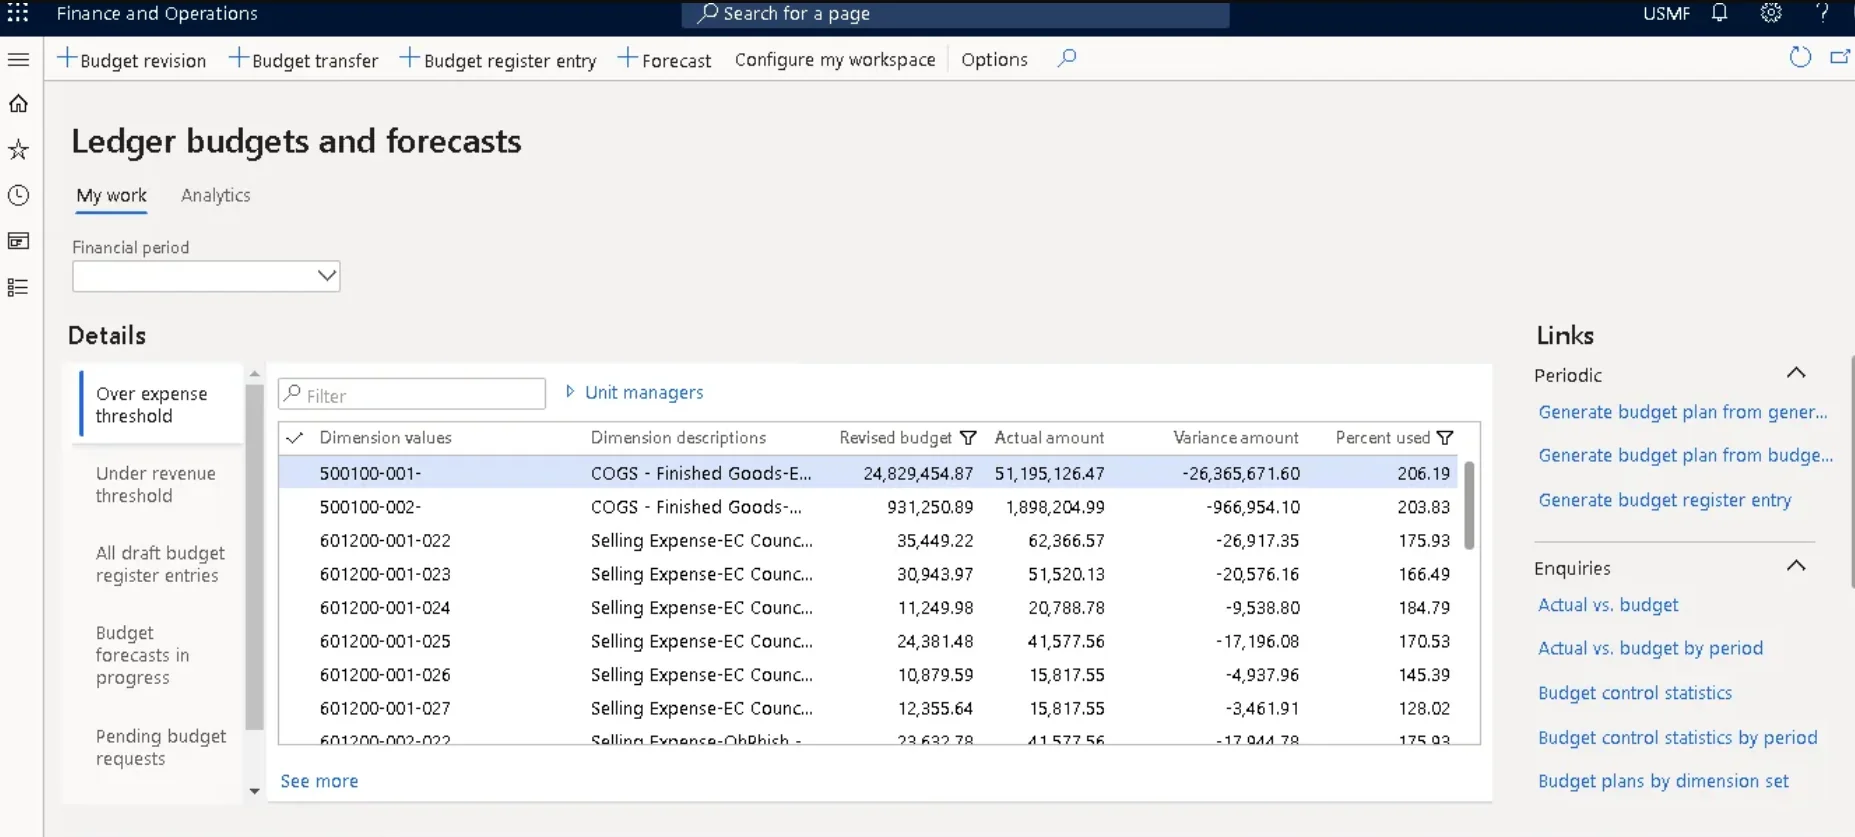
In practice this work is done from the Ledger budgets and forecasts workspace. Its My work tab groups budget activity by exception — dimension values that have breached an expense or revenue threshold, drafts, forecasts in progress and pending requests — while the Analytics tab compares actual against budget for expense, revenue and net income.
Ledger budgets and forecasts — My work
Shows budget activity grouped by exception — over expense threshold, under revenue threshold, draft register entries, forecasts in progress and pending requests — with revised budget, actual amount, variance and percent used. Use it to manage the budget cycle by exception, acting on the dimension values that have already breached threshold rather than reviewing every line.
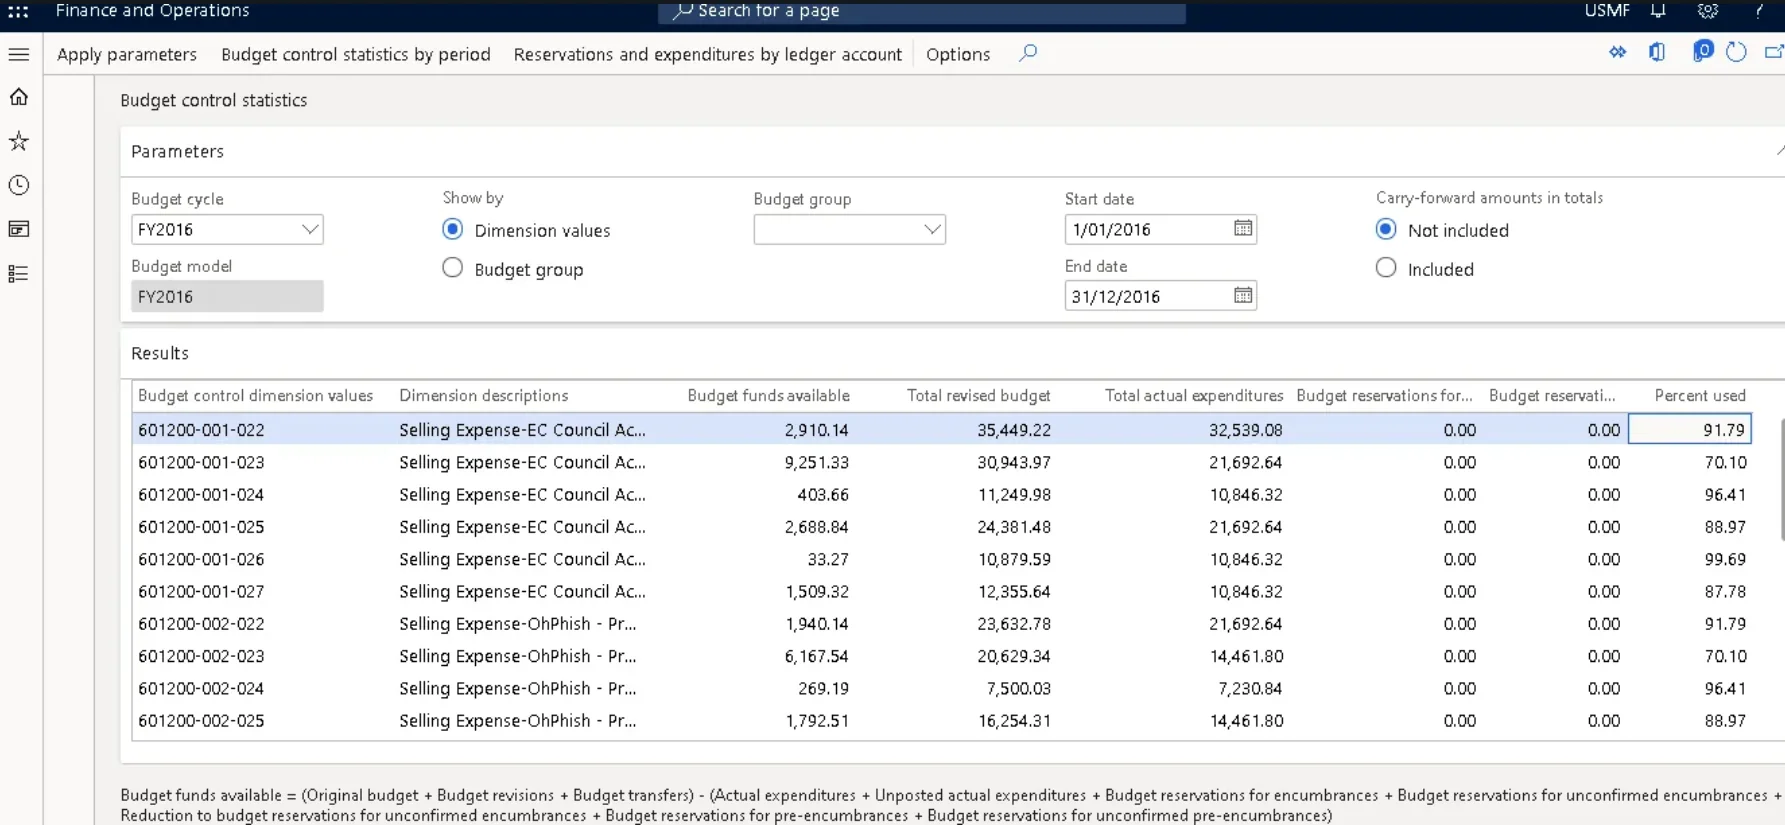
Budget control statistics
Shows budget funds available, total revised budget, total actual expenditures and percent used per budget control dimension value, for the selected budget cycle and date range. Use it before approving new spend — funds available is the figure budget control will test a requisition or purchase order against.
Ledger budgets and forecasts — Analytics
Shows expense, revenue and net income actual against budget, filterable by account category, budget code, main account and period. Use it for the management-level budget summary, then switch to My work or budget control statistics when a number needs to be traced to its source.
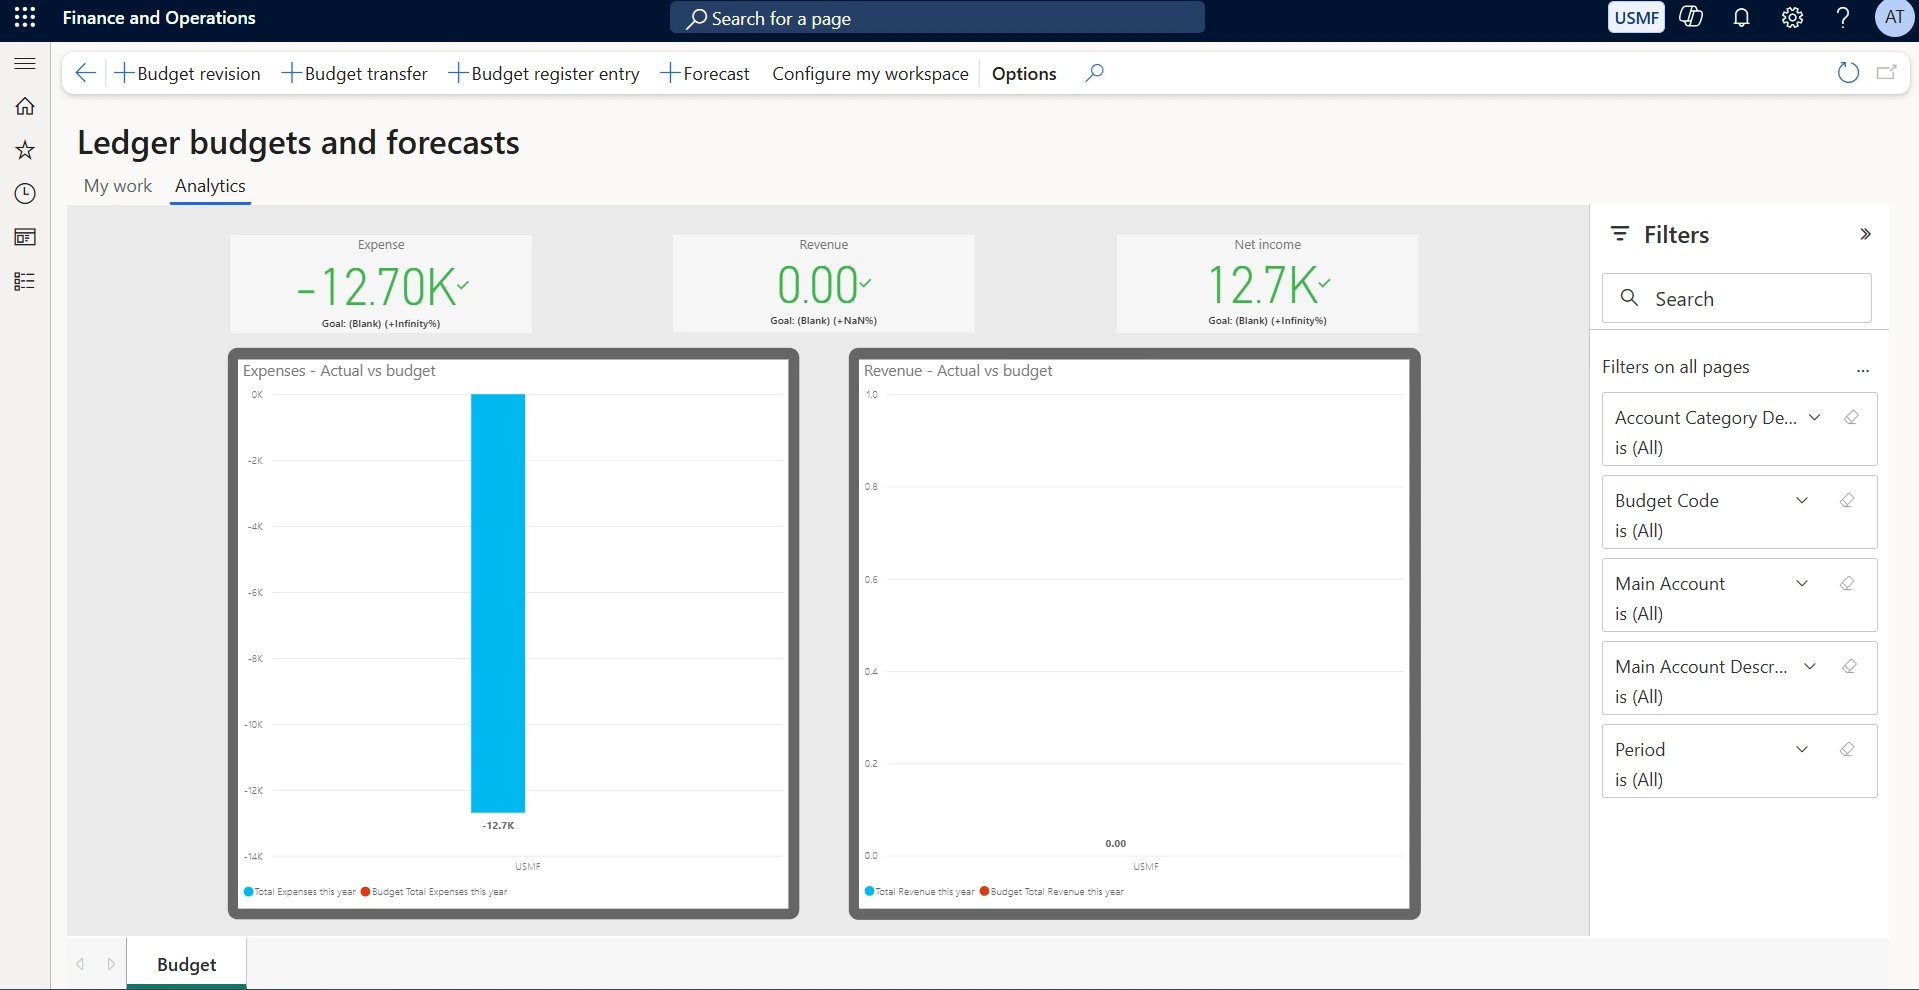
Key metrics & tiles | • Over expense threshold and under revenue threshold — dimension values whose actuals have breached the budget • All draft budget register entries, budget forecasts in progress, and pending budget requests • Revised budget, actual amount, variance amount and percent used, per dimension value • Budget funds available and total actual expenditures, from budget control statistics • Expense, revenue and net income actual against budget on the Analytics tab |
Typical actions & lists | • Create a budget revision, budget transfer, budget register entry or forecast from the action pane • Generate a budget plan from the general ledger or from another budget plan, and generate budget register entries • Run the Actual vs. budget and Budget control statistics enquiries, by period or by ledger account • Feed approved plans into budget register entries and, where enabled, budget control |
Who uses it | • Budget planners and finance managers • Department/cost-center owners contributing plan input |
Why it matters to leadership: Gives finance a structured, auditable path from a draft budget to an approved, system-enforced spending plan — replacing offline spreadsheet cycles with one governed workflow.
Workspaces are not fixed: each user can mark any workspace as a favourite so it appears in a personal shortcut list, and can set an “initial page” in their user options so a specific workspace — rather than the generic dashboard — opens automatically at sign-in. Many workspaces also support workspace-level and section-level filters (for example, by legal entity or date range) that narrow the view without changing the underlying data model. This means the same platform can show a clerk their assigned queue and show a controller a cross-entity rollup, from the same workspace object.
This overview is based on Microsoft's current public documentation, cross-checked in September 2026. A small number of details — noted inline — rely on secondary sources or could not be fully confirmed against a live tenant and are flagged for verification against your specific environment and version.
- Navigation concepts (Dashboard, Workspaces) — https://learn.microsoft.com/en-us/dynamics365/fin-ops-core/dev-itpro/user-interface/page-navigation
- Configure and filter workspaces — https://learn.microsoft.com/en-us/dynamics365/fin-ops-core/fin-ops/get-started/configure-filter-workspaces
- Analytical workspaces (Power BI embedded) — https://learn.microsoft.com/en-us/dynamics365/fin-ops-core/dev-itpro/analytics/embed-power-bi-workspaces
- Financial analysis workspace — https://learn.microsoft.com/en-us/dynamics365/fin-ops-core/dev-itpro/analytics/financial-insights
- CFO Power BI content (legacy) — https://learn.microsoft.com/en-us/dynamics365/fin-ops-core/dev-itpro/analytics/cfo-power-bi
- Financial period close workspace — https://learn.microsoft.com/en-us/dynamics365/finance/general-ledger/financial-period-close-workspace
- Vendor invoice workspace — https://learn.microsoft.com/en-us/dynamics365/finance/accounts-payable/vendor-invoice-workspace
- Vendor payments workspace — https://learn.microsoft.com/en-us/dynamics365/finance/accounts-payable/vendor-payments-workspace
- Vendor collaboration invoicing workspace — https://learn.microsoft.com/en-us/dynamics365/finance/accounts-payable/vendor-portal-invoicing-workspace
- Collections coordinator workspace — https://learn.microsoft.com/en-us/dynamics365/finance/accounts-receivable/collectionsworkspace
- Credit and collections management Power BI content — https://learn.microsoft.com/en-us/dynamics365/finance/accounts-receivable/credit-collections-power-bi
- Bank management workspace — https://learn.microsoft.com/en-us/dynamics365/finance/cash-bank-management/bank-management-workspace
- Cash overview Power BI content — https://learn.microsoft.com/en-us/dynamics365/finance/cash-bank-management/cash-overview-power-bi-content
- Fixed asset management workspace — https://learn.microsoft.com/en-us/dynamics365/finance/fixed-assets/fixed-asset-management-workspace
- Cost control workspace — https://learn.microsoft.com/en-us/dynamics365/finance/cost-accounting/cost-control-workspace
- Budget planning overview — https://learn.microsoft.com/en-us/dynamics365/finance/budgeting/budget-planning-overview-configuration